
Navigation » List of Schools, Subjects, and Courses » Math 136 – Introduction to Statistics » Exams » Final Exam
No Answers We dont have answer to this question yet. If you need help with your homework send us an email  or chat with our tutors
Final Exam
Final Exam
1. In 2003, an organization surveyed 1,508 adult Americans and asked about a certain war, “Do you believe the United States made the right or wrong decision to use military force?” Of the 1,508 adult Americans surveyed, 1090 stated the United States made the right decision. In 2008, the organization asked the same question of 1,508 adult Americans and found that 573 believed the United States made the right decision. Construct and interpret a 90% confidence interval for the difference between the two population proportions,
.
The lower bound of a 90% confidence interval is ______ (Round to three decimal places as needed.)
The upper bound of a 90% confidence interval is _______ (Round to three decimal places as needed.)
Interpret the 90% confidence interval for the difference between the two population proportions,
. Choose the correct answer below.
- There is 10% confidence that the difference in the proportion of adult Americans from 2003 to 2008 who believe the United States made the right decision to use military force in the country is between the lower and upper bounds of the interval.
- There is 90% confidence that the difference in the proportion of adult Americans from 2003 to 2008 who believe the United States made the right decision to use military force in the country is between the lower and upper bounds of the interval.
- There is 90% confidence that the difference in the proportion of adult Americans from 2003 to 2008 who believe the United States made the right decision to use military force in the country is greater than the lower bound.
2. Classify the variable as qualitative or quantitative.
the native languages of students in an English class
- qualitative
- quantitative
3. The lengths of a particular animal’s pregnancies are approximately normally distributed, with mean
days and standard deviation
days.
(a) What proportion of pregnancies lasts more than 281 days?
(b) What proportion of pregnancies lasts between 272 and 284 days?
(c) What is the probability that a randomly selected pregnancy lasts no more than 251 days?
(d) A “very preterm” baby is one whose gestation period is less than 245 days. Are very preterm babies unusual?
(a) The proportion of pregnancies that last more than 281 days is _____. (Round to four decimal places as needed.)
(b) The proportion of pregnancies that last between 272 and 284 days is ______. (Round to four decimal places as needed.)
(c) The probability that a randomly selected pregnancy lasts no more than 251 days is ______. (Round to four decimal places as needed.)
(d) A “very preterm” baby is one whose gestation period is less than 245 days. Are very preterm babies unusual?
The probability of this event is _______ so it ______ be unusual because the probability is _______ than 0.05. (Round to four decimal places as needed.)
4. Explain what 90% confidence” means in a 90% confidence interval.
What does 90% confidence” mean in a 90% confidence interval?
- The value of the parameter lies within 90 % of a standard deviation of the estimate.
- The probability that the value of the parameter lies between the lower and upper bounds of the interval is 90%. The probability that it does not is 10%.
- If 100 different confidence intervals are constructed, each based on a different sample of size n from the same population, then we expect 90 of the intervals to include the parameter and 10 to not include the parameter.
- The confidence interval includes 90% of all possible values for the parameter.
5. The February utility bills (in dollars) for ten residents of a large city are listed below. Find the mode amount.
71 67 67 72 76 72 73 68 72 72
- $72
- $67
- $76
- $73
6. Which branch of statistics deals with the organization and summarization of collected information?
- Survey design
- Computational statistics
- Descriptive statistics
- Inferential statistics
7. The weights (in pounds) of babies born at a certain hospital last month are summarized in the table. Find the class width.
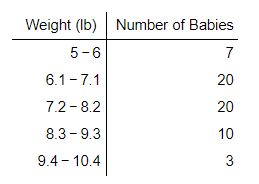
- 1 l
- 1.1 lb
- 1.05 lb
- 1.15 lb
8. What is a Type II error?
- An error that fails to reject
, given that
is true.
- An error that fails to reject
, given that
is false.
- An error that rejects
, given that
is true.
- An error that rejects
, given that
is false.
9. Fill in the blanks to complete the statement.
The _______ _______ is a statement we are trying to find evidence to support.
10. Classify the variable as qualitative or quantitative.
the temperatures of cups of coffee served at a restaurant
- qualitative
- quantitative
11. SAS was used to compare the high school dropout rates for the 30 school districts in one city in 2010 and 2012. The boxplots generated for these dropout rates are
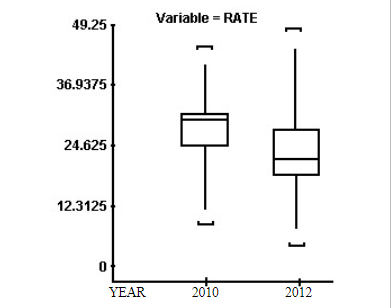
- Dropout rates had a higher average with less variability in 2010 than in 2012.
- Dropout rates had a lower average with more variability in 2010 than in 2012.
- Dropout rates had a higher average with more variability in 2010 than in 2012.
- Dropout rates had a lower average with less variability in 2010 than in 2012.
12. The grades are given for a student for a particular term. Find the grade point average. An A is worth 4 points, a B is worth 3 points, a C is worth 2 points, a D is worth 1 point, and an F is worth 0 points.
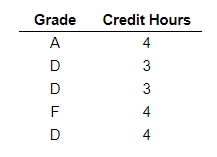
- 0.37
- 1.44
- 1.40
- 3.60
13. A stock analyst wondered whether the mean rate of return of financial, energy, and utility stocks differed over the past 5 years. He obtained a simple random sample of eight companies from each of the three sectors and obtained the 5-year rates of return shown in the accompanying table (in percent). Complete parts (a) through (d) below.
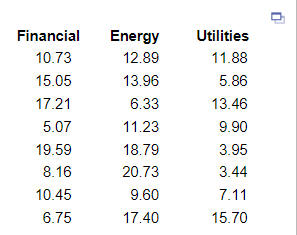
(a) State the null and alternative hypotheses. Choose the correct answer below.
(b) Normal probability plots indicate that the sample data come from normal populations. Are the requirements to use the one-way ANOVA procedure satisfied?
- No, because there are k=3 simple random samples, one from each of k populations, the k samples are independent of each other, and the populations are normally distributed and have the same variance.
- Yes, because there are k=3 simple random samples, one from each of k populations, the k samples are independent of each other, and the populations are normally distributed and have the same variance.
- No, because the largest sample standard deviation is more than twice the smallest sample standard deviation.
- Yes, because there are k=3 simple random samples, one from each of k populations, the k samples are independent of each other, and the populations are normally distributed and have different variances.
(c) Are the mean rates of return different at the
= 0.05 level of significance?
Use technology to find the F-test statistic for this data set.
_____ (Round to two decimal places as needed.)
Determine the P-value and state the appropriate conclusion below.
Since the P-value is _______, there ________ enough evidence to reject the null hypothesis. Thus, we ______ conclude that the mean rates of return are different at the
0.05 level of significance.
14. A player is dealt one card from a 52 card deck. Then the card is replaced in the deck, the deck is shuffled, and the player draws again. Find the probability of the player getting a picture card the first time and a heart the second time. Express the probability as a simplified fraction.
15. In the probability distribution to the right, the random variable X represents the number of marriages an individual aged 15 years or older has been involved in. Complete parts (a) through (f) below.
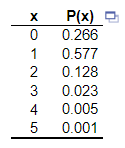
(a) Verify that this is a discrete probability distribution.
This is a discrete probability distribution because ______________ between _____ and ____, inclusive, and the _____ of the probabilities is ____. (Type whole numbers. Use ascending order.)
(b) Draw a graph of the probability distribution. Describe the shape of the distribution.
Describe the shape of the distribution.
The distribution __________ and is __________
(c) Compute and interpret the mean of the random variable X.
______ marriages. (Type an integer or a decimal. Do not round.)
Which of the following interpretations of the mean is correct?
- If any number of individuals aged 15 year or older were surveyed, one would expect the mean number of marriages to be the mean of the random variable.
- The observed number of marriages will be less than the mean number of marriages for most individuals.
- The observed number of marriages will be equal to the mean number of marriages for most individuals.
- If many individuals aged 15 year or older were surveyed, one would expect the mean number of marriages to be the mean of the random variable.
16. Suppose a basketball player is an excellent free throw shooter and makes 94% of his free throws (i.e., he has a 94% chance of making a single free throw). Assume that free throw shots are independent of one another. Suppose this player gets to shoot three free throws. Find the probability that he misses all three consecutive free throws. Round to the nearest ten-thousandth.
- 0.9998
- 0.8306
- 0.0002
- 0.1694
17. Two researchers conducted a study in which two groups of students were asked to answer 42 trivia questions from a board game. The students in group 1 were asked to spend 5 minutes thinking about what it would mean to be a professor, while the students in group 2 were asked to think about soccer hooligans. These pretest thoughts are a form of priming. The 200 students in group 1 had a mean score of 23.9 with a standard deviation of 3.7, while the 20 students in group 2 had a mean score of 15.2 with a standard deviation of 3.2. Complete parts (a) and (b) below.
(a) Determine the 95% confidence interval for the difference in scores,
. Interpret the interval.
The lower bound is _____ .
The upper bound is _____. (Round to three decimal places as needed.)
Interpret the interval. Choose the correct answer below.
- There is a 95% probability that the difference of the means is in the interval.
- The researchers are 95% confident that the difference of the means is in the interval.
- The researchers are 95% confident that the difference between randomly selected individuals will be in the interval.
- There is a 95% probability that the difference between randomly selected individuals will be in the interval.
(b) What does this say about priming?
- Since the 95% confidence interval does not contain zero, the results suggest that priming does have an effect on scores.
- Since the 95% confidence interval contains zero, the results suggest that priming does have an effect on scores.
- Since the 95% confidence interval contains zero, the results suggest that priming does not have an effect on scores.
- Since the 95% confidence interval does not contain zero, the results suggest that priming does not have an effect on scores.
18. Classify the variable as qualitative or quantitative.
the number of seats in a school auditorium
- quantitative
- qualitative
19. The level of significance,
, is the probability of making what?
- A type
error
- A correct decision
- Atype I error
- A type II error
20. The sample space for tossing three fair coins is {HHH, HHT, HTH, HTT, THH, THT, TTH, TTT}. What is the probability of exactly two heads?
- 3
21. If the null hypothesis is rejected when the null hypothesis is true, what type of error, if any, has been made?
- Type
error
- Type I error
- Type II error
- Correct decision
22. Which of the following is not true of statistics?
- Statistics involves collecting and summarizing data.
- Statistics can be used to organize and analyze information.
- Statistics is used to draw conclusions using data.
- Statistics is used to answer questions with 100% certainty.
23. The following Venn diagram is for the six sample points possible when rolling a fair 6-sided die. Let A be the event rolling an even number and let B be the event rolling a number greater than 1. Which of the following events describes the event rolling a 1?
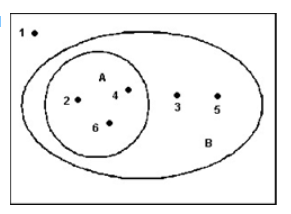
- B
24. Describe the shape of the distribution.
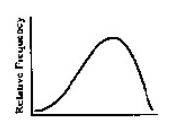
- The distribution is skewed to the left.
- B.The distribution is bell shaped.
- The distribution is skewed to the right.
- The distribution is uniform.
25. Find the value of
.
=
26. The time required for an automotive center to complete an oil change service on an automobile approximately follows a normal distribution, with a mean of 17 minutes and a standard deviation of 2.5 minutes.
(a) The automotive center guarantees customers that the service will take no longer than 20 minutes. If it does take longer, the customer will receive the service for half-price. What percent of customers receive the service for half-price?
(b) If the automotive center does not want to give the discount to more than 3% of its customers, how long should it make the guaranteed time limit?
27. A golf association requires that golf balls have a diameter that is 1.68 inches. To determine if golf balls conform to the standard, a random sample of golf balls was selected. Their diameters are shown in the accompanying data table. Do the golf balls conform to the standards? Use the
level of significance.

First determine the appropriate hypotheses.
Find the test statistic. _____ (Round to two decimal places as needed.)
Find the P-value. _____ (Round to three decimal places as needed.)
What can be concluded from the hypothesis test?
- Do not reject
. There is sufficient evidence to conclude that the golf balls do not conform to the association’s standards at the
level of significance.
- Do not reject
. There is not sufficient evidence to conclude that the golf balls do not conform to the association’s standards at the
level of significance.
- Reject
. There is not sufficient evidence to conclude that the golf balls do not conform to the association’s standards at the
level of significance.
- Reject
. There is sufficient evidence to conclude that the golf balls do not conform to the association’s standards at the
level of significance.
or chat with our tutors