
Navigation » List of Schools, Subjects, and Courses » Math 136 – Introduction to Statistics » Homework Assignment » Week 1 Homework Assignment
With Answers Good news! We are showing you only an excerpt of our suggested answer to this question. Should you need our help in customizing an answer to this question, feel free to send us an email at  or chat with our customer service representative.
Week 1 Homework Assignment
Week 1 Homework Assignment
e the entire group of individuals or items being studied.
2. The _________________ is/are a subset of the population that is being studied.
3. A _________________ is a numerical measurement describing some characteristic of a population.
4. A _________________ is a numerical measurement describing some characteristic of a sample.
5. Suppose that a researcher is interested in the average standardized test score for fifth graders in a local school district. The fifth graders at a specific school would comprise a ___________ and their average test score would be a ___________.
6. A ________________ variable classifies individuals based on some attribute or characteristic.
7. A ________________ variable counts or measures something and has numeric values.
8. Can a qualitative variable have values that are numeric? Why or why not?
Choose the correct answer below.
A. No; by definition, qualitative variables must be categories or nonnumeric data.
B. Yes; it is possible to have numeric variables that do not count or measure anything, and, as a result, are qualitative rather than quantitative.
C. No; numeric variables have values that can be added or subtracted in a meaningful way, making them quantitative rather than qualitative.
D. Yes; all qualitative variables are numeric.
9 Explain why Social Security Number is considered a qualitative variable even though it contains numbers.
Choose the correct answer below.
A. Social Security Number is a qualitative variable since there are a finite or countable number of values.
B.Since Social Security Number is a variable at the interval level of measurement, it must be qualitative rather than quantitative.
C. Addition and subtraction of Social Security Numbers does not provide meaningful results. This makes it qualitative even though it is numeric.
D. Social Security Number is a qualitative variable since there are an infinite number of possible values that are not countable.
10. A quantitative variable that has a finite or countable number of values is called _______.
11. A quantitative variable that has an infinite number of possible values that are not countable is called _______.
12. A(n) _______ is a numerical summary of a sample.
A(n) _______ is a numerical summary of a population.
13. Determine whether the variable is qualitative or quantitative.
Favorite brand of a computer
Is the variable qualitative or quantitative?
A. The variable is qualitative because it is an attribute characteristic
B. The variable is qualitative because it is a numerical measure .
C. The variable is quantitative because it is an attribute characteristic .
D. The variable is quantitative because it is a numerical measure .
14. Determine whether the variable is qualitative or quantitative.
Miles per hour at which a car is traveling
Is the variable qualitative or quantitative?
A. The variable is quantitative because it is an attribute characteristic .
B. The variable is qualitative because it is an attribute characteristic .
C. The variable is quantitative because it is an attribute characteristic
D. The variable is quantitative because it is a numerical measure .
15. Determine whether the variable is discrete or continuous.
Length of rock song
Is the variable discrete or continuous?
A. The variable is continuous because it is not countable.
B. The variable is discrete because it is not countable.
C. The variable is discrete because it is countable.
D. The variable is continuous because it is countable.
16.
Determine whether the variable is discrete or continuous.
Weight of gravel in a pile
Is the variable discrete or continuous?
A. The variable is continuous because it is countable.
B. The variable is discrete because it is countable.
C. The variable is discrete because it is not countable.
D. The variable is continuous because it is not countable.
17.
Determine whether the variable is discrete or continuous.
Number of touchdowns thrown by a quarterback
Is the variable discrete or continuous?
A. The variable is continuous because it is countable.
B. The variable is continuous because it is not countable.
C. The variable is discrete because it is not countable.
D. The variable is discrete because it is countable.
18 . The following Pareto chart shows the position played by the most valuable player (MVP) in a certain baseball league for the last years. Use the chart to answer parts (a) through (d).
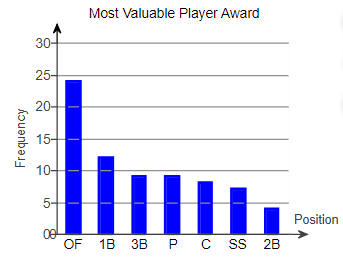
(a) Which position had the most MVPs?
The position with the most MVPs was ____________
(b) How many MVPs played ()?
___ MVPs played .
(c) How many more MVPs played outfield (OF) than ?
_______ more MVPs played outfield than .
(Type a whole number.)
(d) There are three outfield positions (left field, center field, right field). Given this, how might the graph be misleading?
A. The chart seems to show that one position has many more MVPs because three positions are combined into one. They should be separated.
B. The positions or combinations of positions should be chosen so that all the bars are closer together in height.
C. The graph is misleading because the bars are decreasing in height from left to right.
D. All the information is true, so the graph is not misleading.
19. In a poll, a random sample of 2163 adults (aged 18 and over) was asked, “When you see an ad emphasizing that a product is made in your country, are you more likely to buy it, less likely to buy it, or neither more nor less likely to buy it?” The results of the survey are presented in the side-by-side graph. Complete parts (a) through (d) below.
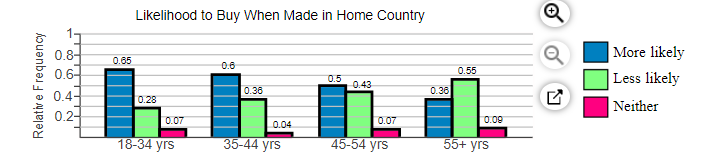
Your answer is correct.
Part 3
Your answer is correct.
Part 4
Your answer is correct.
20 . Determine whether the following statement is true or false.
Stem-and-leaf plots are particularly useful for large sets of data.
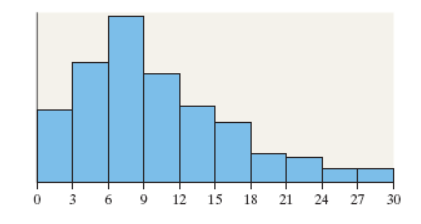
21. Determine whether the following statement is true or false.
The shape of the distribution shown is best classified as skewed left.
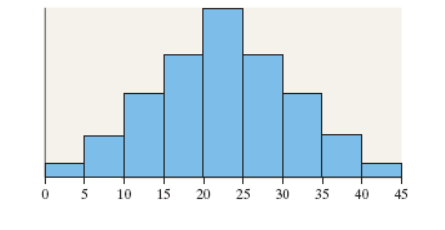
22. Determine whether the following statement is true or false.
The shape of the distribution shown is best classified as uniform.
23. An experiment was conducted in which two fair dice were thrown 100 times. The sum of the pips showing on the dice was then recorded. The frequency histogram to the right gives the results. Use the histogram to complete parts (a) through (f).
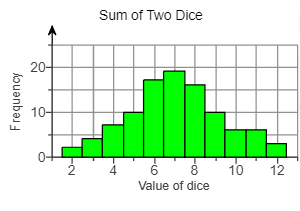
were observed than
was observed.
Your answer is correct.
24. Determine the original set of data.
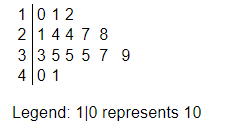
The original set of data is
25. The original set of data is
Your answer is correct.
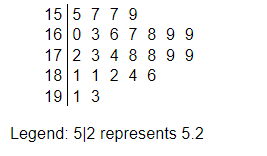
26. The following data represent the number of grams of fat in breakfast meals offered at a local fast food restaurant. (a) Construct an ordered stem-and-leaf plot and (b) describe the shape of the distribution.
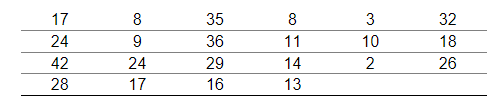
(a) Construct the ordered stem-and-leaf plot below.
Legend: 5 | 1 represents 51 grams of fat.
(b) The distribution is
27 An insurance company crashed four cars of the same model at 5 miles per hour. The costs of repair for each of the four crashes were $, $, $, and $ . Compute the mean, median, and mode cost of repair
Your answer is correct.
Part 2
Your answer is correct.
Part 3
28. The following data represent the amount of time (in minutes) a random sample of eight students took to complete the online portion of an exam in a particular statistics course. Compute the mean, median, and mode time.
Your answer is correct.
Part 2
Your answer is correct.
Part 3
29