
Navigation » List of Schools, Subjects, and Courses » Math 136 – Introduction to Statistics » Homework Assignment » Week 2 Homework Assignment
No Answers We dont have answer to this question yet. If you need help with your homework send us an email  or chat with our tutors
Week 2 Homework Assignment
Week 2 Homework Assignment
1. Jamie has just completed her second semester in college. She earned a grade of C in her 3-hour calculus course, a grade of B in her -2 hour Psychology course, a grade of A in her 4-hour biology course, and a grade of B in her 5 -hour philosophy course. Assuming that A equals 4 points, B equals 3 points, C equals 2 points, D equals 1 point, and F is worth no points, determine ’s grade-point average for the semester.
Jamie’s grade point averageis _____
2. In Marissa’s calculus course, attendance counts for 20% of the grade, quizzes count for 15% of the grade, exams count for 45% of the grade, and the final exam counts for 20% of the grade. Marissa had a 100% average for attendance, 93% for quizzes, 82 % for exams, and 81% on the final. Determine Marissa’s course average.
Marissa’s course average is _____
3. Stan and Francine want to make In order to get the right balance of ingredients for their tastes they bought 2 pounds of potates at $2.74 per pound, 2 pounts of cod for $3.16 per pound and 4 pounts of fish broth for $2.93 per pound Determine the cost per pound of the soup
The cost per pound of the soup is $ ____
4. Suppose babies born after a gestation period of 32 to 35 weeks have a mean weight of 3000 grams and a standard deviation of 900 grams while babies born after a gestation period of 40 weeks have a mean weight of 3600 grams and a standard deviation of 520 grams. If a 35-week gestation period baby weighs 3300 grams and a 40-week gestation period baby weighs 3900 grams, find the corresponding z-scores. Which baby weighs more relative to the gestation period?
Find the corresponding z-scores. Which baby weighs relatively ? Select the correct choice below and fill in the answer boxes to complete your choice.
The baby born in week 40 weighs relatively more since its z-score, __ , is larger than the z-score of ___ for the baby born in week 35.
The baby born in week 35 weighs relatively more since its z-score, ___, is larger than the z-score of ___ for the baby born in week 40.
The baby born in week 40 weighs relatively more since its z-score, ___, is smaller than the z-score of ____ for the baby born in week 35.
The baby born in week 35 weighs relatively more since its z-score, ___, is smaller than the z-score of ____ for the baby born in week 40.
5. In a certain city, the average 20- to 29-year old man is 69.4 inches tall, with a standard deviation of 3.0 inches, while the average 20- to 29-year old woman is 64.5 inches tall, with a standard deviation of 3.9 inches. Who is relatively taller, a 75-inch man or a 70-inch woman?
Find the corresponding z-scores. Who is relatively taller, a 75-inch man or a 70-inch woman? Select the correct choice below and fill in the answer boxes to complete your choice.
The z-score for the man, ___ , is larger than the z-score for the woman, ___, so he is relatively taller.
The z-score for the man ____, is smaller than the z-score for the woman, so he is relatively taller.
The z-score for the woman ______ , is smaller than the z-score for the man, so she is relatively taller.
The z-score for the woman , ___, is larger than the z-score for the man , ___, so she is relatively taller.
6. One year Alex had the lowest ERA (earned-run average, mean number of runs yielded per nine innings pitched) of any male pitcher at his school, with an ERA of 3.02. Also, Karen had the lowest ERA of any female pitcher at the school with an ERA of 3.18 . For the males, the mean ERA was 3.844 and the standard deviation was 0.617 . For the females, the mean ERA was 4.636 and the standard deviation was 0.719 . Find their respective z-scores. Which player had the better year relative to their peers, Alex or Karen? (Note: In general, the lower the ERA, the better the pitcher.)
Alex had an ERA with a z-score of _____
Karen had an ERA with a z-score of ________
Which player had a better year in comparison with their peers?
Karen had a better year because of a lower z-score.
Karen had a better year because of a higher z-score.
Alex had a better year because of a lower z-score.
Alex had a better year because of a higher z-score.
7 The mean finish time for a yearly amateur auto race was 185.42 minutes with a standard deviation of 0.394 minute. The winning car, driven by Chris , finished in 184.65 minutes. The previous year’s race had a mean finishing time of 110.8 with a standard deviation of 0.129 minute. The winning car that year, driven by Karla , finished in 110.57 minutes. Find their respective z-scores. Who had the more convincing victory?
Chris had a finish time with a z-score of _____
Karla had a finish time with a z-score of _____
(Round to two decimal places as needed.)
Which driver had a more convincing victory?
Chris had a more convincing victory because of a higher z-score.
Chris had a more convincing victory because of a lower z-score.
Karla had a more convincing victory because of a higher z-score.
Karla had a more convincing victory because of a lower z-score.
8. A manufacturer of bolts has a quality-control policy that requires it to destroy any bolts that are more than 2 standard deviations from the mean. The quality-control engineer knows that the bolts coming off the assembly line have mean length of 12 cm with a standard deviation of 0.05 cm. For what lengths will a bolt be destroyed?
Select the correct choice below and fill in the answer box(es) to complete your choice.
(Round to one decimal place as needed.)
A bolt will be destroyed if the length is greater than ___ cm
A bolt will be destroyed if the length is less than ___ cm or greater than ___
A bolt will be destroyed if the length is between ____ cm and ___ cm.
A bolt will be destroyed if the length is less than ____ cm.
9. Violent crimes include rape, robbery, assault, and homicide. The following is a summary of the violent-crime rate (violent crimes per 100,000 population) for all states of a country in a certain year. Complete parts (a) through (d).
(a) Provide an interpretation of these results. Choose the correct answer below.
25% of the states have a violent-crime rate that is 272.8 crimes per 100,000 population or more. 50% of the states have a violent-crime rate that is 387.9 crimes per 100,000 population or more. 75% of the states have a violent-crime rate that is 528.3 crimes per 100,000 population or more.
25% of the states have a violent-crime rate that is 272.8 crimes per 100,000 population or less. 50% of the states have a violent-crime rate that is 387.9 crimes per 100,000 population or less. 75% of the states have a violent-crime rate that is 528.3 crimes per 100,000 population or less.
75% of the states have a violent-crime rate that is 272.8 crimes per 100,000 population or less. 50% of the states have a violent-crime rate that is 387.9 crimes per 100,000 population or less. 25% of the states have a violent-crime rate that is 528.3 crimes per 100,000 population or less.
(b) Determine and interpret the interquartile range.
The interquartile range is ___ crimes per 100,000 population.
(Type an integer or a decimal.)
Interpret the interquartile range. Choose the correct answer below.
The middle 25% of all observations have a range of 255.5 crimes per 100,000 population.
All observations have a range of 255.5 crimes per 100,000 population.
The middle 50% of all observations have a range of 115.1 crimes per 100,000 population.
The middle 50% of all observations have a range of 255.5 crimes per 100,000 population.
(c) The violent-crime rate in a certain state of the country in that year was 1,679 . Would this be an outlier?
The lower fence is _____ crimes per 100,000 population.
The upper fence is ______ crimes per 100,000 population.
(Round to two decimal places as needed.)
The violent-crime rate in a certain state of the country in that year was 1,679. Would this be an outlier?
Yes, because it is greater than the upper fence.
Yes, because it is less than the upper fence.
No, because it is greater than the upper fence.
No, because it is less than the upper fence.
(d) Do you believe that the distribution of violent-crime rates is skewed or symmetric?
The distribution of violent-crime rates is skewed left.
The distribution of violent-crime rates is symmetric.
The distribution of violent-crime rates is skewed right.
10. The following data represent the monthly phone use, in minutes, of a customer enrolled in a fraud prevention program for the past 20 months. The phone company decides to use the upper fence as the cutoff point for the number of minutes at which the customer should be contacted. What is the cutoff point?
The cutoff point is ___ minutes.
11 A cellular phone company monitors monthly phone usage. The following data represent the monthly phone use in minutes of one particular customer for the past 20 months. Use the given data to answer parts (a) and (b).
(a) Determine the standard deviation and interquartile range of the data.
s = ____ (Round to two decimal places as needed.)
IQR = ___ (Type an integer or a decimal.)
(b) Suppose the month in which the customer used 337 minutes was not actually that customer’s phone. That particular month the customer did not use their phone at all, so 0 minutes were used. How does changing the observation from 337 to 0 affect the standard deviation and interquartile range? What property does this illustrate?
The standard deviation _____ and the interquartile range is _________.
What property does this illustrate? Choose the correct answer below.
Empirical Rule
Weighted Mean
Dispersion
Resistance
12. After giving a statistics exam, Professor Dang determined the following five-number summary for her class results.
59, 67, 77, 90, 99
Use this information to draw a boxplot of the exam scores.
Choose the correct graph below.
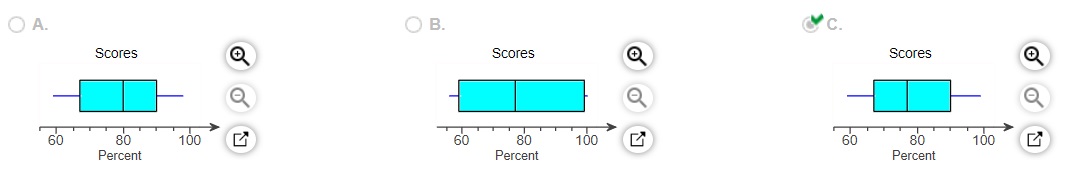
13 The data represent the age of world leaders on their day of inauguration. Find the five-number summary, and construct a boxplot for the data. Comment on the shape of the distribution.
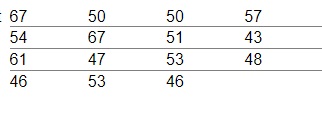
The five-number summary is
43, 47 , 51, 57, 67.
Choose the correct boxplot of the data below.
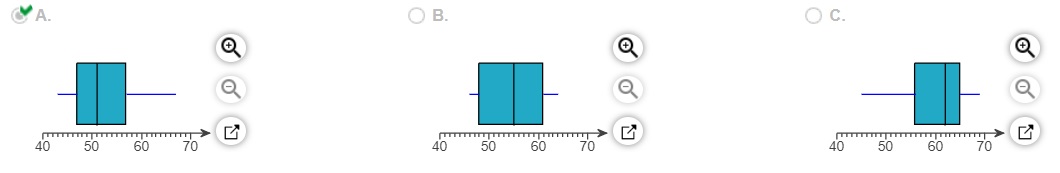
Choose the correct description of the shape of the distribution.
The distribtuion is roughly symmetric
The distribution is skewed to the left
The distribution is skewed to the right
The shape of the distribution cannot be determined from the boxplot.
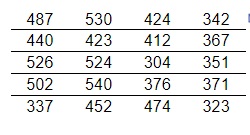
14 The following data represent the dividend yields (in percent) of a random sample of 28 publicly traded stocks. Complete parts (a) to (c).
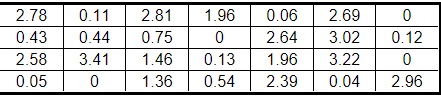
(a) Compute the five-number summary.
The five-number summary is ____, _____, _____, _____, _____
(Round to two decimal places as needed. Use ascending order.)
(b) Draw a boxplot of the data.
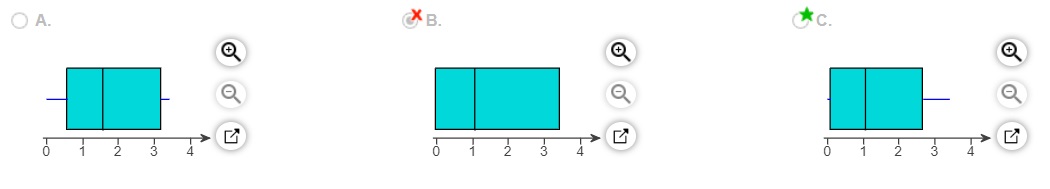
(c) Determine the shape of the distribution from the boxplot.
The distribution is skewed to the right.
The distribution is roughly symmetric.
The distribution is skewed to the left.
The shape of the distribution cannot be determined from the boxplot.
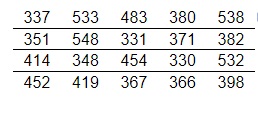
15. The following data represent the weights (in grams) of a simple random sample of 50 candies. Draw a boxplot of these data. Use the boxplot and quartiles to decide if the distribution is symmetric.
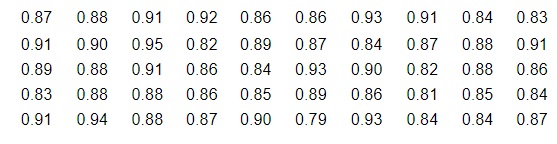
Draw a boxplot of the data. Choose the correct graph below.
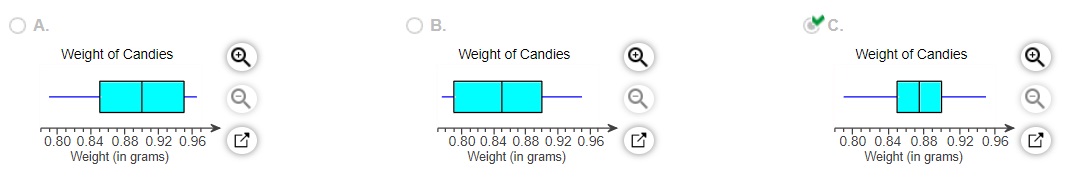
Is the distribution symmetric?
No
Yes
16 The data to the right represent the number of chocolate chips per cookie in a random sample of a name brand and a store brand. Complete parts (a) to (c) below.
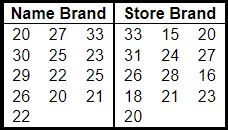
(a) Draw side-by-side boxplots for each brand of cookie. Label the boxplots “N” for the name brand and “S” for the store brand. Choose the correct answer below.
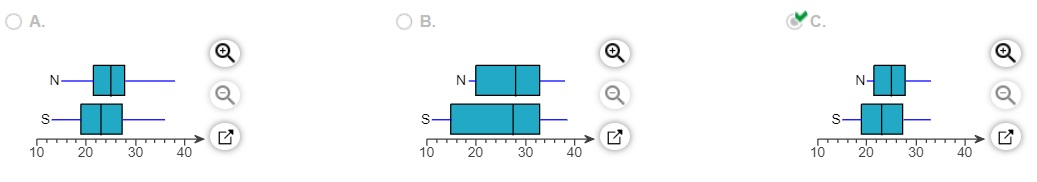
b) Does there appear to be a difference in the number of chips per cookie?
Yes. The store brand appears to have more chips per cookie.
Yes. The name brand appears to have more chips per cookie.
No. There appears to be no difference in the number of chips per cookie.
There is insufficient information to draw a conclusion.
(c) Does one brand have a more consistent number of chips per cookie?
No. Both brands have roughly the same number of chips per cookie.
Yes. The store brand has a more consistent number of chips per cookie.
Yes. The name brand has a more consistent number of chips per cookie.
There is insufficient information to draw a conclusion.
17. Select the correct choice that completes the sentence below.
(This is a reading assessment question. Be certain of your answer because you only get one attempt on this question.)
For a distribution that is skewed left, the left whisker is _______ the right whisker.
or chat with our tutors