
Navigation » List of Schools, Subjects, and Courses » Math 136 – Introduction to Statistics » Homework Assignment » Week 4 Homework Assignment
With Answers Good news! We are showing you only an excerpt of our suggested answer to this question. Should you need our help in customizing an answer to this question, feel free to send us an email at  or chat with our customer service representative.
Week 4 Homework Assignment
Week 4 Homework Assignment
1. Is there a relation between the age difference between husband/wives and the percent of a country that is literate? Researchers found the least-squares regression between age difference (husband age minus wife age), y, and literacy rate (percent of the population that is literate), x, is
. The model applied for
x. Complete parts (a) through (e) below.
(a) Interpret the slope. Select the correct choice below and fill in the answer box to complete your choice.
For every unit increase in ________, the __________falls by ____ units, on average. (Type an integer or decimal. Do not round.)
(b) Does it make sense to interpret the y-intercept? Explain. Choose the correct answer below.
Yes it makes sense to interpret the y-intercept because an x-value of 0 is within the realm of possibilities.
No it does not make sense to interpret the y-intercept because a y-value of 0 is impossible.
No it does not make sense to interpret the y-intercept because an x-value of 0 is impossible.
No it does not make sense to interpret the y-intercept because an x-value of 0 is outside the scope of the model.
No it does not make sense to interpret the y-intercept because a y-value of 0 is outside the scope of the model.
(c) Predict the age difference between husband/wife in a country where the literacy rate is percent.
______ years (Round to one decimal place as needed.)
(d) Would it make sense to use this model to predict the age difference between husband/wife in a country where the literacy rate is %?
No it does not make sense because an x-value of is outside the scope of the model.
No it does not make sense because a y-value of is outside the scope of the model.
Yes it makes sense because a y-value of is within the realm of possibilities and within the scope of the model.
Yes it makes sense because an x-value of is within the realm of possibilities and within the scope of the model.
(e) The literacy rate in a country is 98 % and the age difference between husbands and wives is 2 years. Is this age difference above or below the average age difference among all countries whose literacy rate is 98 %? Select the correct choice below and fill in the answer box to complete your choice.
(Round to one decimal place as needed.)
Below the average age difference among all countries whose literacy rate is 98 % is ___ years
Above the average age difference among all countries whose literacy rate is 98% is ___ years
2. The data below represent commute times (in minutes) and scores on a well-being survey. Complete parts (a) through (d) below.
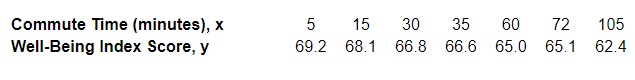
(a) Find the least-squares regression line treating the commute time, x, as the explanatory variable and the index score, y, as the response variable.
(Round to three decimal places as needed.)
(b) Interpret the slope and y-intercept, if appropriate. Interpret the slope. Select the correct choice below and, if necessary, fill in the answer box to complete your choice.
For an index score of zero, the commute time is predicted to be ___ minutes . (Round to three decimal places as needed.)
For a commute time of zero minutes, the index score is predicted to be ____ (Round to three decimal places as needed.)
For every unit increase in index score, the commute time falls by ___, on average. (Round to three decimal places as needed.)
For every unit increase in commute time, the index score falls by _____, 0.063, on average. (Round to three decimal places as needed.)
It is not appropriate to interpret the slope.
Interpret the y-intercept. Select the correct choice below and, if necessary, fill in the answer box to complete your choice.
For every unit increase in index score, the commute time by ____, on average. (Round to three decimal places as needed.)
For a commute time of zero minutes, the index score is predicted to be _____. (Round to three decimal places as needed.)
For an index score of zero, the commute time is predicted to be _____minutes. (Round to three decimal places as needed.)
For every unit increase in commute time, the index score falls by _____ on average. (Round to three decimal places as needed.)
It is not appropriate to interpret the y-intercept because a commute time of zero minutes does not make sense and the value of zero minutes is much smaller than those observed in the data set.
(c) Predict the well-being index of a person whose commute time is 25 minutes.
The predicted index score is ______ (Round to one decimal place as needed.)
(d) Suppose Barbara has a 20 -minute commute and scores 67.0 on the survey. Is Barbara more “well-off” than the typical individual who has a 20-minute commute? Select the correct choice below and fill in the answer box to complete your choice. (Round to one decimal place as needed.)
Yes, Barbara is more well-off because the typical individual who has a 20-minute commute scores ____
No, Barbara is less well-off because the typical individual who has a 20-minute commute scores ____
3. A pediatrician wants to determine the relation that exists between a child’s height, x, and head circumference, y. She randomly selects 11 children from her practice, measures their heights and head circumferences, and obtains the accompanying data. Complete parts (a) through (g) below.
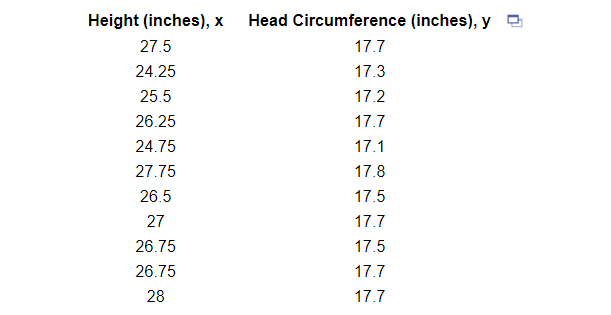
(a) Find the least-squares regression line treating height as the explanatory variable and head circumference as the response variable.
(Round the slope to three decimal places and round the constant to one decimal place as needed.)
(b) Interpret the slope and y-intercept, if appropriate.
First interpret the slope. Select the correct choice below and, if necessary, fill in the answer box to complete your choice.
For a height of 0 inches, the head circumference is predicted to be ___ (Round to three decimal places as needed.)
For every inch increase in height, the head circumference increases by _____ in., on average. (Round to three decimal places as needed.)
For a head circumference of 0 inches, the height is predicted to be ____ in. (Round to three decimal places as needed.)
For every inch increase in head circumference, the height increases by ____ in. on average. (Round to three decimal places as needed.)
It is not appropriate to interpret the slope.
Interpret the y-intercept, if appropriate. Select the correct choice below and, if necessary, fill in the answer box to complete your choice.
For a head circumference of 0 inches, the height is predicted to be ____ in. (Round to one decimal place as needed.)
For every inch increase in head circumference, the height increased by ____ in., on average. (Round to one decimal place as needed.)
For every inch increase in height, the head circumference increases by ____ in., on average. (Round to one decimal place as needed.)
For a height of 0 inches, the head circumference is predicted to be ___ in. (Round to one decimal place as needed.)
It is not appropriate to interpret the y-intercept.
(c) Use the regression equation to predict the head circumference of a child who is 24.75 inches tall.
(Round to two decimal places as needed.)
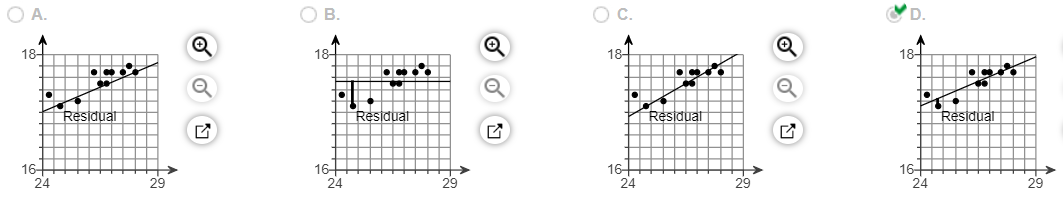
(d) Compute the residual based on the observed head circumference of the 24.75 -inch-tall child in the table. Is the head circumference of this child above or below the value predicted by the regression model?
The residual for this observation is ____, meaning that the head circumference of this child is ____ the value predicted by the regression model. (Round to two decimal places as needed.)
(e) Draw the least-squares regression line on the scatter diagram of the data and label the residual from part (d). Choose the correct graph below.
(f) Notice that two children are 26.75 inches tall. One has a head circumference of 17.5 inches; the other has a head circumference of 17.7 inches. How can this be?
For children with a height of 26.75 inches, head circumferences vary.
The only explanation is that the difference was caused by measurement error.
The only explanation is that the difference is due to the fact that one observation was of a boy, and one observation was of a girl.
There is no logical explanation for thisthe two observations in question should have had the same head circumference.
(g) Would it be reasonable to use the least-squares regression line to predict the head circumference of a child who was 32 inches tall? Why?
Nothis height is not possible.
Yesthis height is possible and within the scope of the model.
Yesthe calculated model can be used for any child’s height.
Nothis height is outside the scope of the model.
More information regarding the child is necessary to make the decision.
4. An engineer wants to determine how the weight of a gas-powered car, x, affects gas mileage, y. The accompanying data represent the weights of various domestic cars and their miles per gallon in the city for the most recent model year. Complete parts (a) through (d) below.
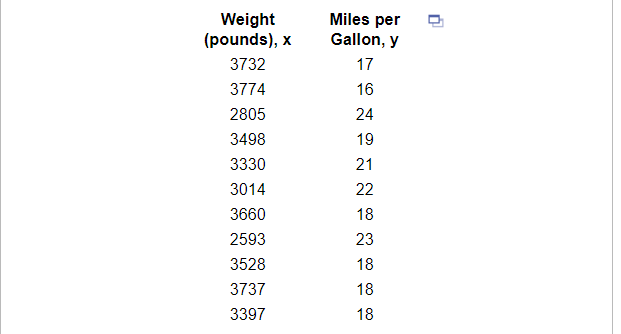
(a) Find the least-squares regression line treating weight as the explanatory variable and miles per gallon as the response variable.
(Round the x coefficient to five decimal places as needed. Round the constant to two decimal places as needed.)
(b) Interpret the slope and y-intercept, if appropriate. Choose the correct answer below and fill in any answer boxes in your choice.
(Use the answer from part a to find this answer.)
A weightless car will get ____ enter your response here miles per gallon, on average. It is not appropriate to interpret the slope.
For every pound added to the weight of the car, gas mileage in the city will decrease by ___ mile(s) per gallon, on average. A weightless car will get __ miles per gallon, on average.
For every pound added to the weight of the car, gas mileage in the city will decrease by _____ mile(s) per gallon, on average. It is not appropriate to interpret the y-intercept.
It is not appropriate to interpret the slope or the y-intercept.
(c) A certain gas-powered car weighs 3600 pounds and gets 20 miles per gallon. Is the miles per gallon of this car above average or below average for cars of this weight?
Below
Above
(d) Would it be reasonable to use the least-squares regression line to predict the miles per gallon of a hybrid gas and electric car? Why or why not?
No, because the hybrid is a different type of car.
No, because the absolute value of the correlation coefficient is less than the critical value for a sample size of n11.
Yes, because the hybrid is partially powered by gas.
.
Yes, because the absolute value of the correlation coefficient is greater than the critical value for a sample size of n11.
5. Because colas tend to replace healthier beverages and colas contain caffeine and phosphoric acid, researchers wanted to know whether cola consumption is associated with lower bone mineral density in women. The accompanying data lists the typical number of cans of cola consumed in a week and the femoral neck bone mineral density for a sample of 15 women. Complete parts (a) through (f) below.
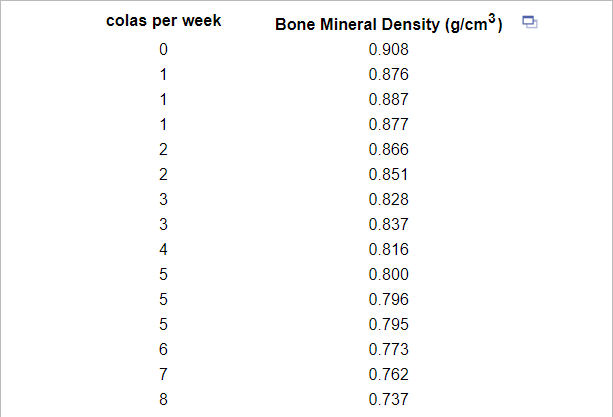
(a) Find the least-squares regression line treating cola consumption per week as the explanatory variable.
(Round to three decimal places as needed.)
(b) Interpret the slope. Select the correct choice below and, if necessary, fill in the answer box to complete your choice.
For every unit increase in bone density, the number of colas decreases by ___, on average. (Round to three decimal places as needed.)
For 0 colas consumed in a week, the bone density is predicted to be ____
(Round to three decimal places as needed.)
For a bone density of 0
, the number of colas consumed is predicted to be ____ (Round to three decimal places as needed.)
For every cola consumed per week, the bone density decreases by ____
, on average (Round to three decimal places as needed.)
It is not appropriate to interpret the slope.
(c) Interpret the y-intercept. Select the correct choice below and, if necessary, fill in the answer box to complete your choice.
For every cola consumed per week, the bone density decreases by ___
, on average. (Round to three decimal places as needed.)
For every unit increase in bone density, the number of colas decreases by ____, on average. (Round to three decimal places as needed.)
For 0 colas consumed in a week, the bone density is predicted to be _____
(Round to three decimal places as needed.)
For a bone density of 0
, the number of colas consumed is predicted to be ____ in (Round to three decimal places as needed.)
It is not appropriate to interpret the y-intercept.
(d) Predict the bone mineral density of the femoral neck of a woman who consumes three colas per week.
(Round to three decimal places as needed.)
(e) The researchers found a woman who consumed three colas per week to have a bone mineral density of 0.829
. Is this woman’s bone density above or below average among all women who consume three colas per week?
This women’s bone density is ____ the average of ____
(Round to three decimal places as needed.)
(f) Would you recommend using the model found in part (a) to predict the bone mineral density of a woman who consumes two colas per day? Why? Select the correct choice below and, if necessary, fill in the answer box to complete your choice.
Yes — an x-value that represents a woman consuming ____ colas per week is possible and within the scope of the model. (Type an integer or a simplified fraction.)
No–an x-value that represents a woman consuming ____ colas per week is outside the scope of the model. (Type an integer or a simplified fraction.)
Yes– the calculated model can be used for any number of colas consumed per week.
No– an x-value that represents a woman consuming ____ colas per week is not possible. (Type an integer or a simplified fraction.)
More information regarding the woman is necessary to make the decision.
6. The accompanying data represent the number of days absent, x, and the final exam score, y, for a sample of college students in a general education course at a large state university. Complete parts (a) through (e) below.
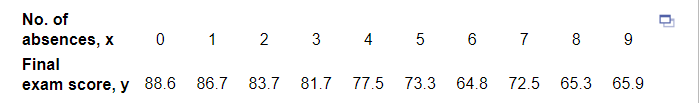
(a) Find the least-squares regression line treating number of absences as the explanatory variable and the final exam score as the response variable.
_____(Round to three decimal places as needed.)
(b) Interpret the slope and the y-intercept, if appropriate. Choose the correct answer below and fill in any answer boxes in your choice. (Round to three decimal places as needed.)
The average final exam score of students who miss no classes is ___. It is not appropriate to interpret the slope.
For every additional absence, a student’s final exam score drops _____ points, on average. It is not appropriate to interpret the y-intercept.
For every additional absence, a student’s final exam score drops _____ points, on average. The average final exam score of students who miss no classes is ____
It is not appropriate to interpret the slope or the y-intercept.
(c) Predict the final exam score for a student who misses five class periods.
(Round to two decimal places as needed.)
Compute the residual.
____ (Round to two decimal places as needed.)
Is the final exam score above or below average for this number of absences?
Below
Above
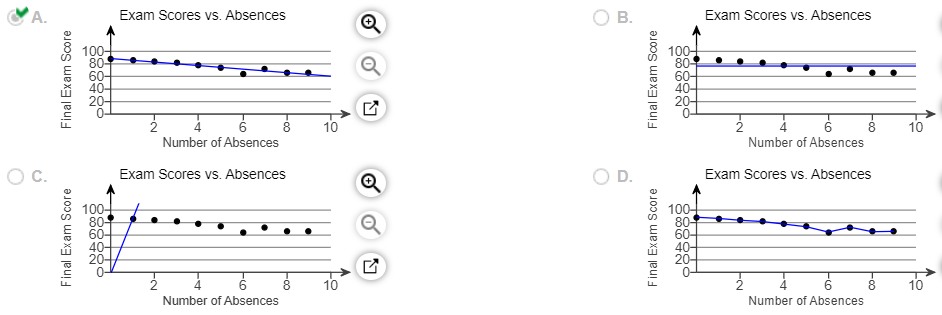
(d) Draw the least-squares regression line on the scatter diagram of the data. Choose the correct graph below.
(e) Would it be reasonable to use the least-squares regression line to predict the final exam score for a student who has missed 15 class periods? Why or why not?
Yes, because the absolute value of the correlation coefficient is greater than the critical value for a sample size of n10.
No, because the absolute value of the correlation coefficient is less than the critical value for a sample size of n10.
Yes, because the purpose of finding the regression line is to make predictions outside the scope of the model.
No, because 15 absences is outside the scope of the model.
7. The data in the table represent the number of licensed drivers in various age groups and the number of fatal accidents within the age group by gender. Complete parts (a) through (c) below.
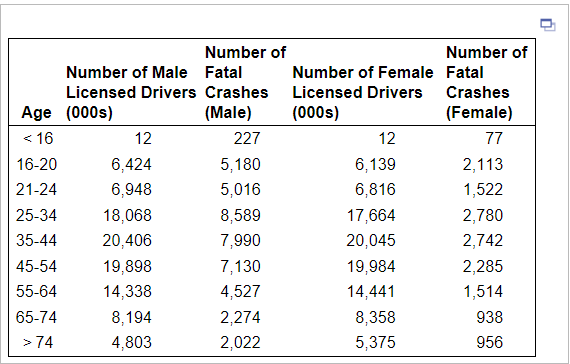
(a) Find the least-squares regression line for males treating the number of licensed drivers as the explanatory variable, x, and the number of fatal crashes, y, as the response variable. Repeat this procedure for females.
Find the least-squares regression line for males.
(Round the x coefficient to three decimal places as needed. Round the constant to the nearest integer as needed.)
Find the least-squares regression line for females.
(Round the x coefficient to three decimal places as needed. Round the constant to the nearest integer as needed.)
(b) Interpret the slope of the least-squares regression line for each gender, if appropriate. How might an insurance company use this information?
What is the correct interpretation of the slope of the least-squares regression line for males? Select the correct choice below and, if necessary, fill in the answer box to complete your choice. (Use the answer from part a to find this answer.)
If the number of fatal crashes increases by 1, then the number of male licensed drivers increases by ____ thousand, on average.
If the number of male licensed drivers increases by 1 (thousand), then the number of fatal crashes increases by _____, on average.
If the average age of all male licensed drivers increases by 1, then the number of fatal crashes increases by ____, on average.
It does not make sense to interpret the slope.
What is the correct interpretation of the slope of the least-squares regression line for females? Select the correct choice below and, if necessary, fill in the answer box to complete your choice. (Use the answer from part a to find this answer.)
If the number of female licensed drivers increases by 1 (thousand), then the number of fatal crashes increases by _____, on average.
If the number of fatal crashes increases by 1, then the number of female licensed drivers increases by _____ thousand, on average.
If the average age of all female licensed drivers increases by 1, then the number of fatal crashes increases by _____, on average.
It does not make sense to interpret the slope.
The slope of the regression line for males is _________ that for females. This means that males tend to be involved in ___________________ females. An insurance company may use this information to argue for _______________
(c) Was the number of fatal accidents for 16 to 20 year old males above or below average? Was the number of fatal accidents for 21 to 24 year old males above or below average? Was the number of fatal accidents for males greater than 74 years old above or below average? How might an insurance company use this information? Does the same relationship hold for females?
The number of fatal accidents for 16 to 20 year old males was ____________.
The number of fatal accidents for 21 to 24 year old males was ____________ .
The number of fatal accidents for males greater than 74 years old was ________ .
An insurance company could use it to argue for higher rates for _________ drivers and lower rates for ______ drivers.
Does the same relationship hold for females?
No
Yes
8. Is the following a probability model? What do we call the outcome green?
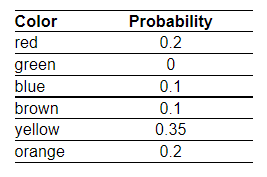
Is the table above an example of a probability model?
Yes, because the probabilities sum to 1 and they are all greater than or equal to 0 and less than or equal to 1
No, because not all the probabilities are greater than 0.
No, because the probabilities do not sum to 1
Yes, because the probabilities sum to 1
What do we call the outcome green?
Not so unusual event
Impossible event
Certain event
Unusual event
9. Which of the following numbers could be the probability of an event?
1 , -0.46, 0, 0.04, 1.41, 0.37
The numbers that could be a probability of an event are ___________
(Use a comma to separate answers as needed.)
10. Suppose you toss a coin 100 times and get 74 heads and 26 tails. Based on these results, what is the probability that the next flip results in a tail?
The probability that the next flip results in a tail is approximately ____ (Type an integer or decimal rounded to two decimal places as needed.)
11. According to a certain country’s department of education, 41.4% of 3-year-olds are enrolled in day care. What is the probability that a randomly selected 3-year-old is enrolled in day care?
The probability that a randomly selected 3-year-old is enrolled in day care is _____ (Type an integer or a decimal.)
12. A survey of randomly selected high school students determined that 212 play organized sports.
(a) What is the probability that a randomly selected high school student plays organized sports?
(b) Interpret this probability.
(a) The probability that a randomly selected high school student plays organized sports is ____. (Round to the nearest thousandth as needed.)
(b) Choose the correct answer below. (Type a whole number.)
If 1,000 high school students were sampled, it would be expected that exactly _____ of them play organized sports.
If 1,000 high school students were sampled, it would be expected that about _____ of them play organized sports.
13. In a recent survey, it was found that the median income of families in country A was $57,300. What is the probability that a randomly selected family has an income than $57,300?
What is the probability that a randomly selected family has an income greater than $57,300?
14 A golf ball is selected at random from a golf bag. If the golf bag contains 7green balls, 6 black balls, and 8 brown balls, find the probability of the following event.
The golf ball is green or black .
The probability that the golf ball is green or black is __________
15. A golf ball is selected at random from a golf bag. If the golf bag contains 6 type A balls, 4 type B balls, and 3 type C balls, find the probability that the golf ball is not a type A ball.
The probability that the golf ball is not a type A ball is ______. (Type an integer or decimal rounded to three decimal places as needed.)
16 A standard deck of cards contains 52 cards. One card is selected from the deck.
(a) Compute the probability of randomly selecting a diamond or heart
(b) Compute the probability of randomly selecting a diamond, or heart, or club.
(c) Compute the probability of randomly selecting a ten or spade
(a) P(diamond or heart) = ____ (Type an integer or a decimal rounded to three decimal places as needed.)
(b) P(diamond or heart or club ) = ____ (Type an integer or a decimal rounded to three decimal places as needed.)
(c) P(ten or spade) = ___ (Type an integer or a decimal rounded to three decimal places as needed.)