
Navigation » List of Schools, Subjects, and Courses » Math 136 – Introduction to Statistics » Quizzes » Quiz 2
No Answers We dont have answer to this question yet. If you need help with your homework send us an email  or chat with our tutors
Quiz 2
Quiz 2
1. Problem 1. The 2010 Census results include a summary of the racial composition of the US population. The races reported by the populations of the United States and the State of California are summarized below. The data are given in millions.
| Race | US | CA |
| White | 223.6 | 21.5 |
| Black or African American | 38.9 | 2.3 |
| American Indian and Alaska Native | 2.9 | 0.4 |
| Asian | 14.7 | 4.9 |
| Native Hawaiian and other Pacific Islander | 0.5 | 0.1 |
| Some other race | 19.1 | 6.3 |
| Two or more races | 9.0 | 1.8 |
(a) (1 point) Is the data categorical or quantitative
(b) (1 point) Construct a relative frequency distribution of races in CA
(c) (1 point) What percentage of CA residents are two or more races?
(d) (1 point) What percentage of CA residents are not white?
(e) (1 point) Use StatCrunch to make a side-by-side relative frequency bar graph of the US and California data
(f) (1 point) What is it best to use relative frequences to compare the populations of the U.S. and Calfornia.
2. Problem 2. The follow data represent the diameter, in inches, of a random sample of thirty four chocolate chip cookies.
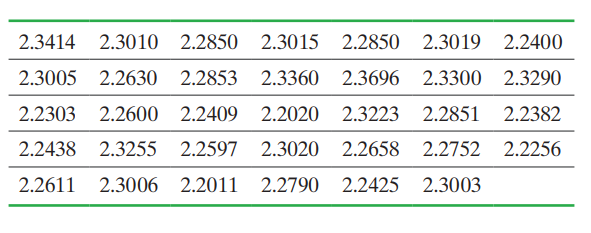
(a) (1 point) is the data discrete or continuous?
(b) (1 point) Use StatCrunch to make a frequency table starting at 2.2 with a class width of 0.025
(c) (1 point) Use StatCrunch to make a frequency histogram starting at 2.2 with a class width of 0.025
(d) (1 point) What is the shape of the distribution?
or chat with our tutors