
Navigation » List of Schools, Subjects, and Courses » Math 136 – Introduction to Statistics » Quizzes » Quiz 3
No Answers We dont have answer to this question yet. If you need help with your homework send us an email  or chat with our tutors
Quiz 3
Quiz 3
1. Problem 1. The following data represent the monthly closing price of Twitter stock from November 2013 to October 2014, one year after the company went public.
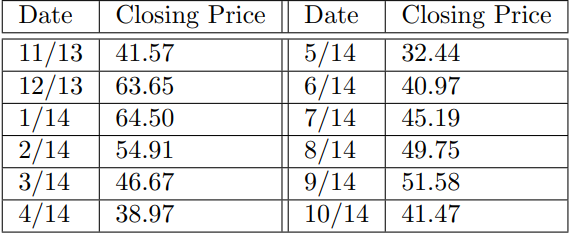
(a) (1 point) What type of graph would be used to display the data? Use StatCrunch to make the graph.
(b) (1 point) Compute the percent change in stock price from June 2014 to July 2014.
2. Problem 2. The following data are the asking prices, in dollars, for a random sample of 2015 Honda Civics and a random sample of 2015 Toyota Camrys
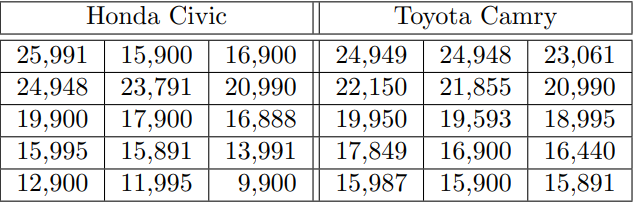
(a) (2 points) Find the mean and median price for each car.
(b) (2 points) Find the standard deviation for each car. Which car has a more dispersed asking price?
(c) (2 points) Use StatCrunch to make a histogram of the asking prices of the Toyota Camry. Which measure of center
best describes the price of a 2015 Toyota Camry? Why?
3. Problem 3. A kinesiologist wants to study the heart rates of long distance runners. She obtains a sample of male runners and has them run on a treadmill for ten minutes. Their heart rates in beats per minute have a bell-shaped distribution with a mean of 104 bpm and a standard deviation of 12.5 bpm.
(a) (2 points) What percentage of runners have a heart rate greater than 91.5 bpm?
(b) (2 points) What percentage of runners have a heart rate less than 66.5 bpm or more than 129 bpm?
(c) (2 points) What percentage of runners have a heart rate between 79 bpm and 116.5 bpm?
or chat with our tutors