
Navigation » List of Schools, Subjects, and Courses » Math 136 – Introduction to Statistics » Quiz » Quiz 2C Describing Data
No Answers We dont have answer to this question yet. If you need help with your homework send us an email  or chat with our tutors
Quiz 2C Describing Data
Quiz 2C Describing Data
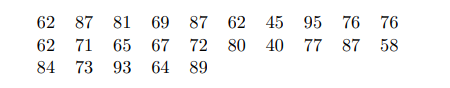
Use the data of exam scores below to answer the following questions:
1. (2 points) Make a stem and leaf plot.
2. (2 points) Make a histogram of the data. Be sure to sketch the histogram and take a minute or two to ensure the sketch is similar to what you see in statcrunch.
3. (2 points) Are there any advantages to using one plot over another? Explain.
HINT Answer: How are the two plots similar? How are the two plots different?
4. (4 points) Refer back to the graphics you produced in the last problems.
a) A student who sketched the histogram says “The data is skewed right.”
Do you agree or disagree with this student? Explain why.
b) Based on the histogram (don’t compute anything), where would you say the center of the exam data is? Why would that be the center.
c) Find two statistics which can be used to represent the center of the data. Write them below using correct symbols.
5. (4 points) Complete the following table using exam data given in the last page.

or chat with our tutors