
Navigation » List of Schools, Subjects, and Courses » Math 136 – Introduction to Statistics » Quiz » Exam 1
No Answers We dont have answer to this question yet. If you need help with your homework send us an email  or chat with our tutors
Exam 1
Exam 1
1. For the first two parts, Identify the bias (Sampling, Response, Non-Response) in the following scenario and briefly explain how you can fix that bias.
(a) (4 points) Fit & Fuel, a small bike shop wishes to determine what improvements it can implement to improve sales. The shop’s manager survey’s customer at the store all week long to get their feedback.
(b) (4 points) A TSA (Transportation Security Administration) instructs employees to ’randomly select’ individuals who will undergo further ’security screening.’ TSA agents will simply select individuals on the spot ’at random.’
(c) (4 points) Give an example of how Wording of a Question can result in Bias. How do you fix this?
2.
(a) (3 points) In your own words, what is Cluster Sampling. What is Stratified Sampling?
(b) (4 points) A hiring manager doesn’t wish to review through the 314 resumes for a recent job opening.
To simplify his life he will take a simple random sample of 5 resumes to call in for interviews. Be sure to discuss how you obtain sample if you use Row 8 in the random digits table provided. Write out all individuals selected.
3. The following data represent the top speed (in kilometers per hour) of all the players (except goaltenders) in the 2014 World Cup Soccer Tournament.

(a) (3 points) Find the Relative Frequency Distribution for the data given below.
(b) (2 points) Suppose the student wishes to use Chebychev’s Theorem to approximate the minimum percentage of data within 2.5 standard deviations of the mean. Find the percentage (show all work.)
(c) (2 points) Now, suppose the student wants to use Empirical Rule. Find the percentage of data that emprirical rule guarantees to be within 2 standard deviations. Does empirical rule apply to this data?
4 . See data set link in Canvas! The U.S. Census Bureau tracks a lot of data from every state. One of the data it reports is the two-year average percentage of persons living in poverty by state. For the years of 2012-2013 it reported the following data:
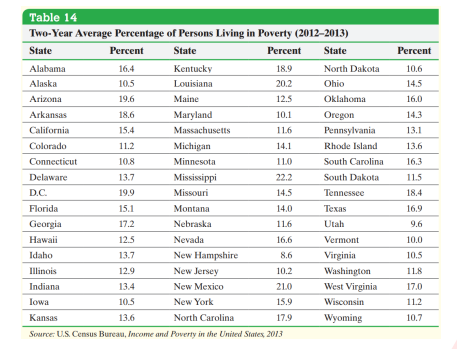
(a) Make a histogram of the percentage of persons living in Poverty. Be sure to accurately sketch the figure(s) below.
(b) (3 points) Is the data skewed left or is the data skewed right? Explain.
(c) (3 points) The Median of the data set is know to be M = 11.3. WITHOUT COMPUTING ANYTHING, would the mean be higher or lower? Explain how you know.
(d) 4 points) Would you say there is a state with lots of poverty? Find the percentage of persons living in Poverty which can be considered unusual according to the data given here. Show all relevant work.
5. See data set link in Canvas! In the article, The Effect of Paternal Smoking on the Birthweight of Newborns Whose Mothers Did Not Smoke, from the American Jounal of Public Health examined birth weight against the smoking habit of the newborn’s father.
Birth weights for newborn babies (in grams) of nonsmoking mothers were obtained and divided into two groups, nonsmoking fathers and smoking fathers. The given data are representative of the data collected by the researchers

(a) (2 points) Given that the data is quantitative, what kind of visual display is possible? What kind of visual display would you NOT want to recommend someone create using this data?
(b) (2 points) Find and sketch a side-by-side boxplot of the data.
(c) (4 points) Use the side-by-side boxplot visual to answer: are there any differences between the data sets? Find the two numbers to support your claims above. You should have four numbers for a full answer.
(d) (4 points) Suppose a newborn weights 4200 grams. Use z-scores to determine in which category (Nonsmokers vs. Smokers) the weight of 4200 is ’better’ when compared to the rest of the weights.
or chat with our tutors