
Navigation » List of Schools, Subjects, and Courses » Econ 101 – Principles of Microeconomics » Practice Tests » Practice Test 3
With Answers Good news! We are showing you only an excerpt of our suggested answer to this question. Should you need our help in customizing an answer to this question, feel free to send us an email at  or chat with our customer service representative.
Practice Test 3
Practice Test 3
1.
| Number of workers | Marginal product of workers |
| 1 | 5 |
| 2 | 7 |
| 3 | 8 |
| 4 | 10 |
| 5 | 11 |
| 6 | 7 |
| 7 | 5 |
| 8 | 3 |
| 9 | 0 |
| 10 | -1 |
Refer to the table shown. A firm would be most likely to hire between:
3 and 4 workers.
1 and 3 workers.
5 and 8 workers.
8 and 10 workers
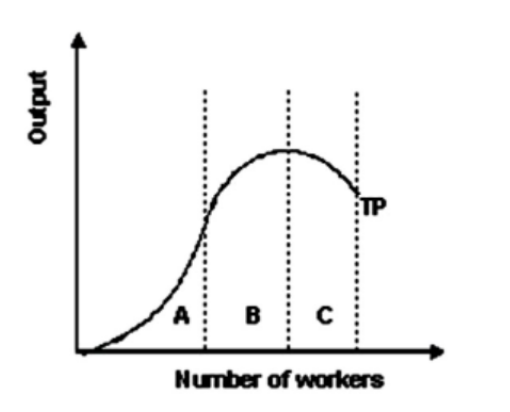
2. Refer to the graph shown. Within which section(s) of the production function is marginal product decreasing?
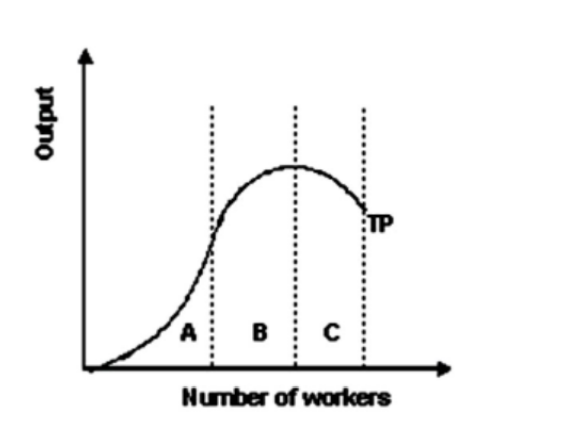
A and B
B
B and C
A
3.
The following graph shows average fixed costs, average variable costs, average total costs, and marginal costs of production.

Refer to the graph shown. Marginal cost is minimized when output equals:
12 units.
6 units.
21 units.
25 units.
4.
The following graph shows average fixed costs, average variable costs, average total costs, and marginal costs of production.
Refer to the graph shown. Average variable cost is minimized when output equals:
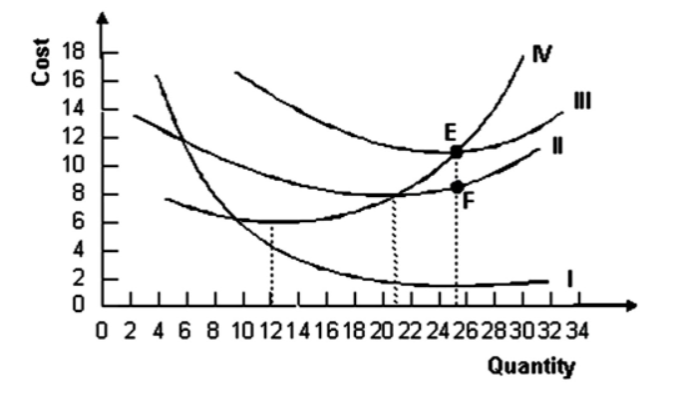
21 units.
25 units.
12 units.
6 units.
5.
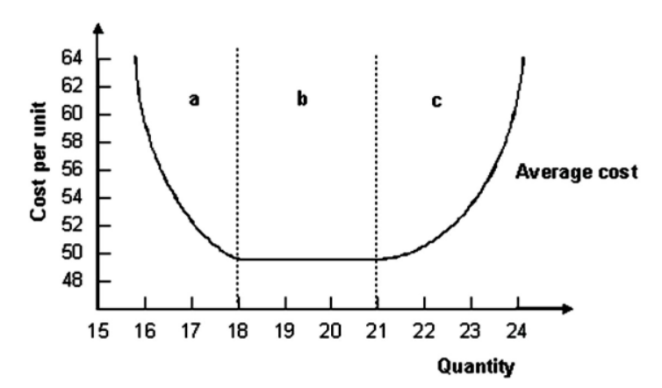
. Refer to the graph shown. The output range in region a is associated with:
increasing marginal productivity.
economies of scale.
diseconomies of scale.
constant returns to scale.
6.
The supply curve of a perfectly competitive firm is:
the average total cost curve only if price exceeds average variable cost.
the marginal cost curve only if price exceeds average variable cost.
the marginal cost curve only if price exceeds average total cost.
nonexistent.
7. A firm can use 50 workers and 10 machines, 70 workers and 9 machines, or 75 workers and 9 machines to produce 40 chairs. If each worker costs $20 and each machine is rented for $500, the economically efficient input combination is:
70 workers and 9 machines.
50 workers and 10 machines.
75 workers and 9 machines.
none of these input combinations.
8 The following graph shows average fixed costs, average variable costs, average total costs, and marginal costs of production.
Refer to the graph shown. Why does the distance between curves II and III get smaller as quantity increases?
Average fixed cost is increasing.
Average variable cost is increasing.
Average fixed cost is declining.
Marginal cost is increasing.
9.
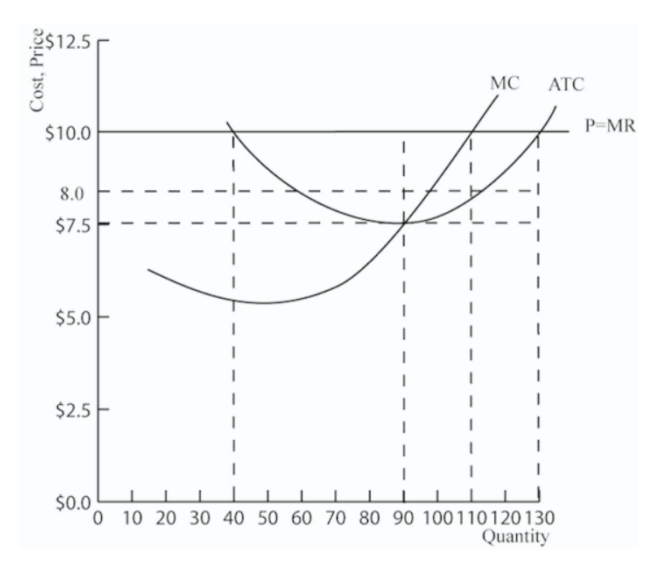
Refer to the graph shown, which depicts a perfectly competitive firm. When it is maximizing profit, the total profit earned by this firm is roughly:
$200.
$300.
$605.
$250.
10.
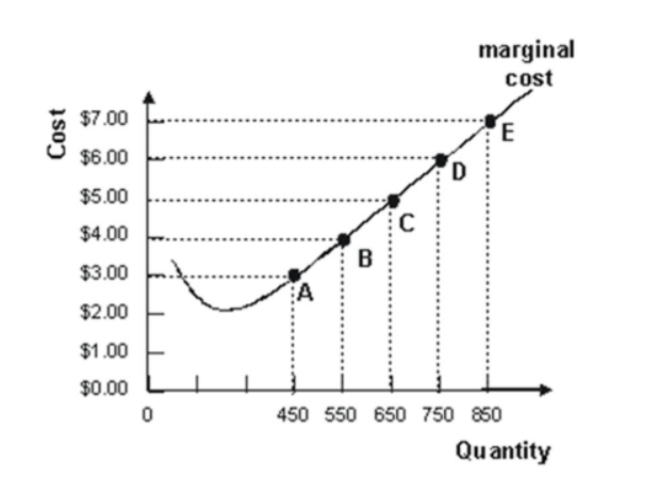
Refer to the graph shown depicting a perfectly competitive firm. If average variable cost is $3 at quantity 450, points A through E represent the:
firm’s total revenue curve.
firm’s supply curve.
firm’s total cost curve.
demand for the firm’s product.
11. Generally, as the size of a firm increases:
team spirit increases.
marginal productivity rises.
monitoring costs increase.
economies of scope fall.
- Refer to the graph shown. The output range in region c is associated with:
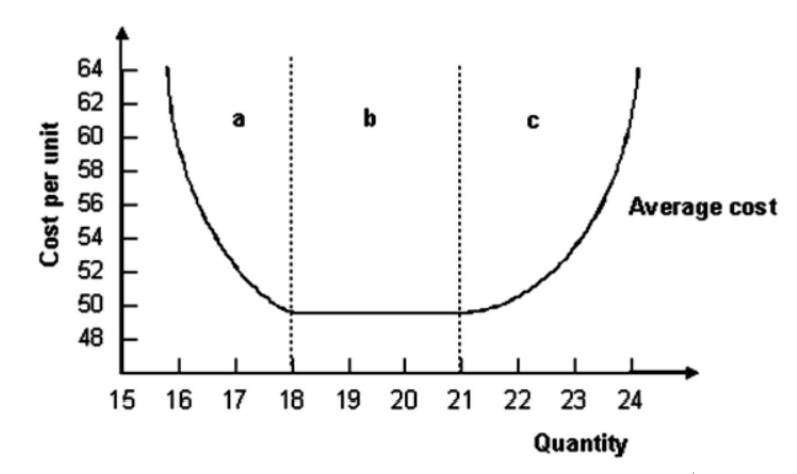
economies of scale.
constant returns to scale.
diseconomies of scale.
diminishing marginal productivity.
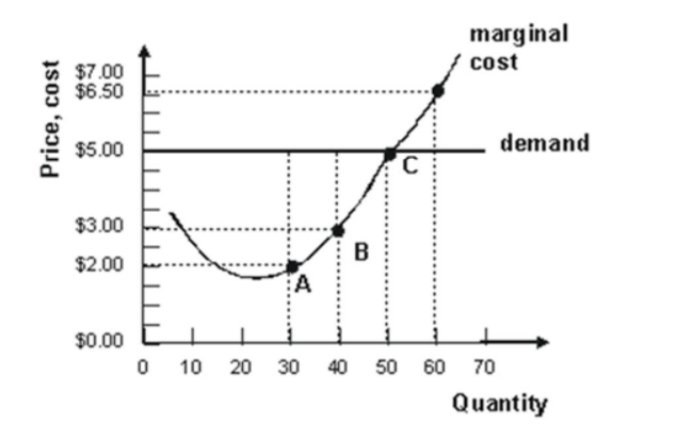
- Refer to the graph shown. Suppose that the market price is $5. At this price, a perfectly competitive firm should:
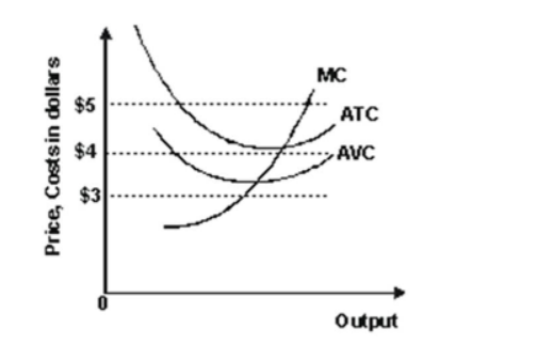
continue to produce in the short run but shut down in the long run.
shut down in the short run but continue production in the long run.
continue to produce in both the short run and the long run.
shut down immediately.
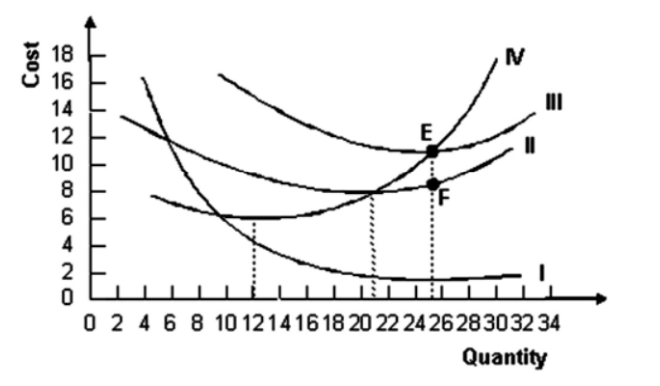
- The following graph shows average fixed costs, average variable costs, average total costs, and marginal costs of production.
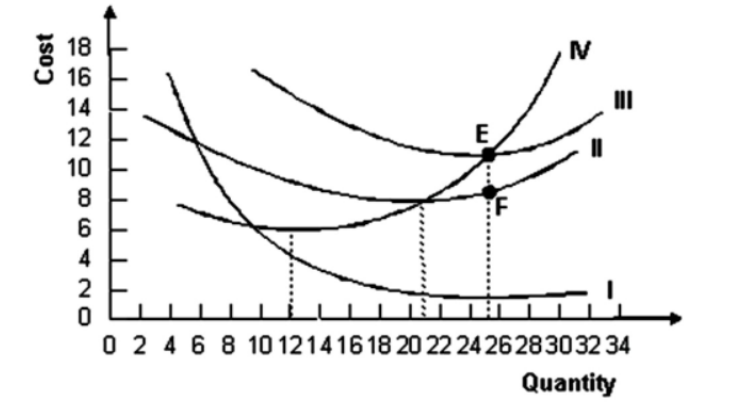
Refer to the graph shown. The distance EF represents:
marginal cost.
average fixed cost.
average variable cost.
average total cost.
- Suppose that the firms in the perfectly competitive oat industry currently are receiving a price of $2 per bushel for their product. The minimum possible average total cost of producing oats in the long run is $1 per bushel. It follows that:
firms in the oat industry will earn economic profits in both the long run and the short run.
new firms will enter the oat industry.
the price of oats will remain at $2 per bushel in the long run.
the oat industry is in equilibrium.
- Accounting profit is equal to:
total revenue minus explicit measurable costs.
total revenue minus implicit costs.
implicit and explicit revenues minus implicit costs.
total revenue minus implicit and explicit costs.
- To manufacture 1,000 pairs of shoes in a week, a firm must use at least 1,500 workers and 5 machines or 100 machines and 150 workers. Which method can be technically efficient?
both
neither
1,500 workers and 5 machines
150 workers and 100 machines
- Refer to the graph shown. What level of output should the perfectly competitive firm produce to maximize profits?
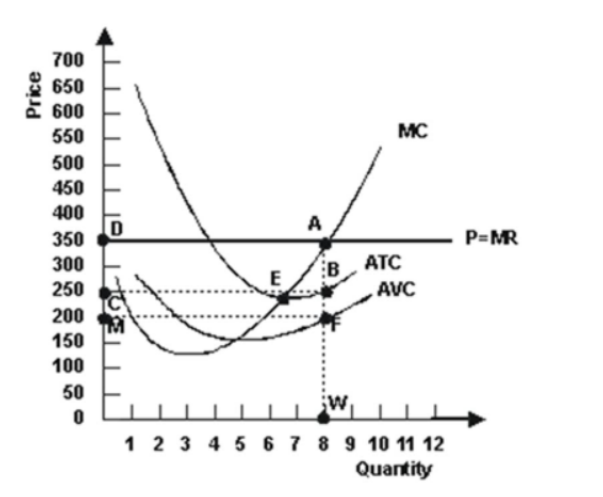
4
8
6
7
- A business owner makes 50 items by hand in six hours. She could have earned $10 an hour working for someone else. If each item sells for $5 and the explicit costs total $14, economic profit equals:
$0.
$176.
$236.
$64.
- When car makers began to cut the costs of producing cars by designing the chassis, engine, and transmissions so that different models could be produced on the same assembly line, production costs fell $240 per car. This idea best illustrates:
diminishing marginal product.
constant returns to scale.
economies of scale.
diseconomies of scale.
- To manufacture 1,000 pairs of shoes in a week, a firm can use 1,500 workers and 50 machines or 100 machines and 2,000 workers. Which method is more technically efficient?
1,500 workers and 50 machines
Neither could be considered efficient.
Both are equally efficient.
2,000 workers and 100 machines
- Refer to the table shown. Diminishing marginal productivity begins when the:
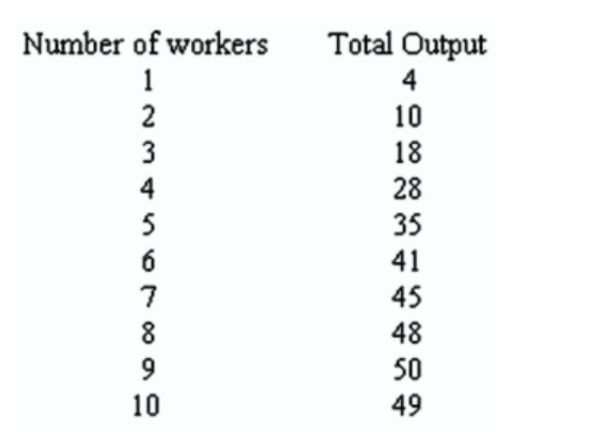
sixth worker is hired.
fourth worker is hired.
fifth worker is hired.
third worker is hired.
- The long-run average cost of producing 12 units of output is $54; the long-run average cost of producing 13 units is $56. These numbers imply that:
economies of scope are present.
economies of scale are present.
diminishing marginal productivity is present.
diseconomies of scale are present.
- Refer to the graph shown. Suppose the market price is $3. At this price, a perfectly competitive firm should:
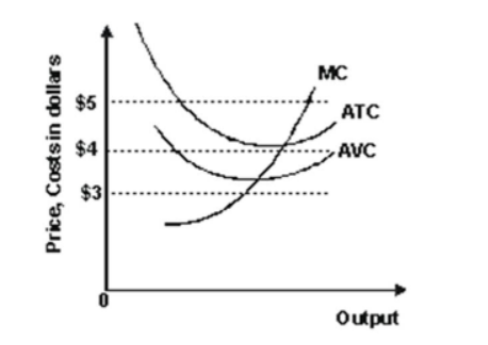
continue to produce in both the short run and the long run.
continue to produce in the short run but shut down in the long run.
shut down in the short run but continue production in the long run.
shut down immediately.
- At one time, sea lions were depleting the stock of steelhead trout. One idea to scare sea lions away from the Washington coast was to launch fake killer whales, which are predators of sea lions. The cost of making the first whale is $16,000 ($5,000 for materials and $11,000 for the mold). The mold can be reused to make additional whales, and so additional whales cost $5,000 each. Based on these numbers, the average total cost of making five fake killer whales would be:
$36,000.
$11,000.
$5,000.
$7,200
- Rachel left her job as a graphic artist, where she earned $42,000 per year, to open her own graphic arts firm. Her explicit costs for her new business include:
only her forgone salary of $42,000 per year.
neither the expenses incurred for office space, equipment, and supplies nor her forgone salary of $42,000 per year.
only the expenses incurred for office space, equipment, and supplies.
both the expenses incurred for office space, equipment, and supplies and her forgone salary of $42,000 per year
- The reason for the merger of two businesses that sell unrelated goods but can share business practices and sales forces might best be explained by:
indivisible costs.
learning by doing.
economies of scope.
economies of scale.
- Refer to the graph shown. Assuming that the industry operates under conditions of perfect competition:
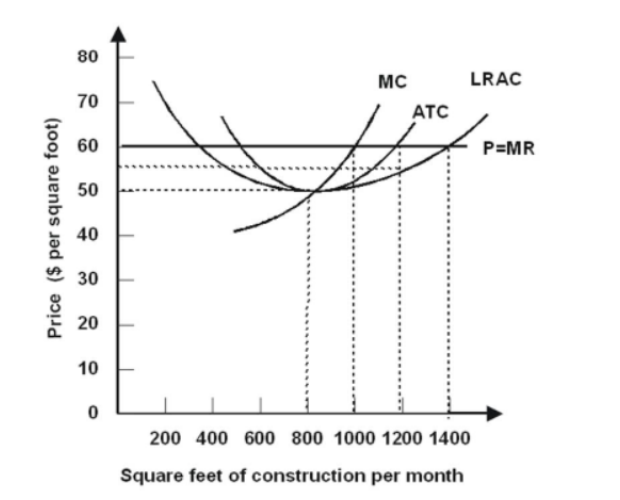
it is currently in equilibrium.
existing firms will leave the industry.
new firms will soon enter the industry.
firms in the industry are earning zero economic profit.
- Refer to the table shown. Marginal cost is minimized when how many units of output are produced?
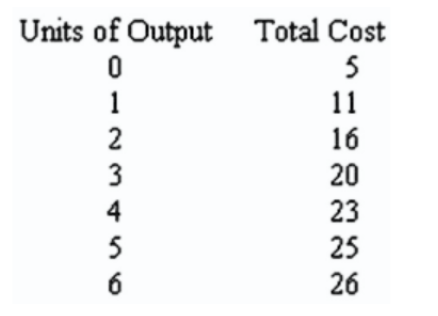
6
4
5
3
- Refer to the graph shown. Within which section(s) of the production function is the marginal product of labor decreasing?
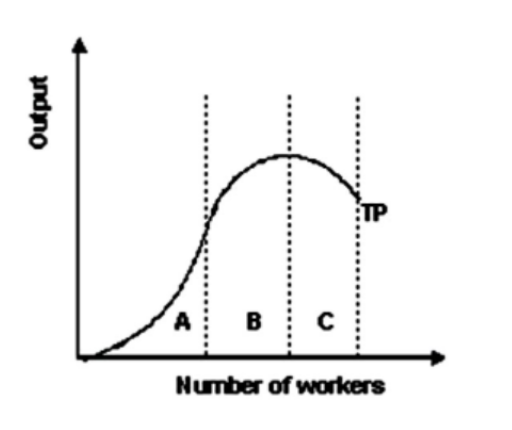
A only
C only
B and C
B only
- Refer to the graph shown. Currently, if this perfectly competitive firm is maximizing profit, the market price is:
$6.50 and marginal revenue for the firm is $5.00.
$6.50 and marginal revenue for the firm is $6.50.
$5.00 and marginal revenue for the firm is $3.00.
$5.00 and marginal revenue for the firm is $5.00.
- Refer to the graph shown. Within which section(s) of the production function is marginal product increasing?
A
B
C
A and B