
Navigation » List of Schools, Subjects, and Courses » Math 136 – Introduction to Statistics » Homework » Section 3.5 Question 3
No Answers We dont have answer to this question yet. If you need help with your homework send us an email  or chat with our tutors
Section 3.5 Question 3
Section 3.5 Homework
3. The following data represent the weights (in grams) of a simple random sample of 50 candies. Draw a boxplot of these data. Use the boxplot and quartiles to decide if the distribution is symmetric.
0.85, 0.89, 0.87, 0.81, 0.89, 0.86, 0.88, 0.86, 0.86, 0.92, 0.89, 0.94, 0.89, 0.86, 0.86, 0.90, 0.80, 0.84, 0.84, 0.85, 0.84, 0.87, 0.82
0.83, 0.88, 0.84, 0.85, 0.91, 0.87, 0.76, 0.91, 0.82, 0.88, 0.84, 0.91, 0.89, 0.85, 0.80, 0.79, 0.82, 0.82, 0.86, 0.86, 0.83, 0.82, 0.81
0.89, 0.84, 0.82, 0.85
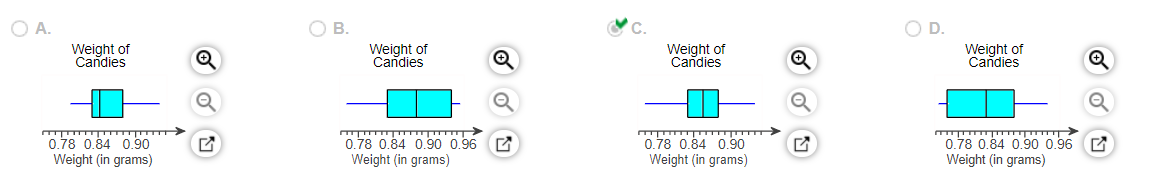
Draw a boxplot of the data. Choose the correct graph below.
Is the distribution symmetric?
- Yes
- No.
or chat with our tutors