
Navigation » List of Schools, Subjects, and Courses » Math 136 – Introduction to Statistics » Homework » Section 3.5 Question 4
No Answers We dont have answer to this question yet. If you need help with your homework send us an email  or chat with our tutors
Section 3.5 Question 4
Question
Section 3.5 Homework
4. Which of the accompanying boxplots likely has the data with the larger standard deviation? Why?
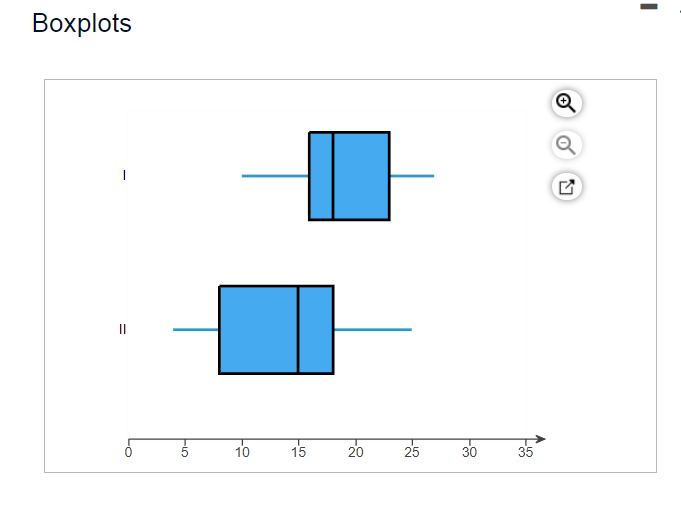
Choose the correct answer below.
- Boxplot II likely has the data with the larger standard deviation because the boxplot appears to have a greater spread, which likely results in a larger standard deviation.
- Boxplot I likely has the data with the larger standard deviation because the values associated with Boxplot I are larger than the values associated with Boxplot II, which likely results in a larger standard deviation.
- Boxplot II likely has the data with the larger standard deviation because the median is less than the median of Boxplot I, which likely results in a larger standard deviation.
- Boxplot I likely has the data with the larger standard deviation because the IQR is smaller than that of Boxplot II, which likely results in a larger standard deviation.
We don’t have answer to this question yet.If you need help with your homework send us an email at or chat with our tutors
or chat with our tutorsThis question is taken from Math 136 – Introduction to Statistics » Summer 2021 » Homework