
Navigation » List of Schools, Subjects, and Courses » Math 136 – Introduction to Statistics » Quiz 2 » Quiz 2 Question 6
No Answers We dont have answer to this question yet. If you need help with your homework send us an email  or chat with our tutors
Quiz 2 Question 6
Quiz 2
6. An experiment was conducted in which two fair dice were thrown 100 times. The sum of the pips showing on the dice was then recorded. The frequency histogram to the right gives the results. Use the histogram to complete parts (a) through (f).
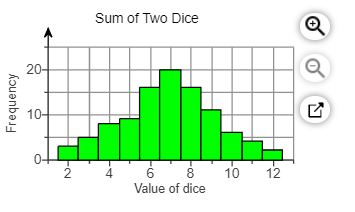
(a) What was the most frequent outcome of the experiment?
(b) What was the least frequent?
(c) How many times did we observe a 6?
(d) How many more 8’s were observed than 9’s?
(e) Determine the percentage of time a 6 was observed.
(f) Describe the shape of the distribution. Choose the correct answer below.
- Bell-shaped
- Skewed right
- Skewed left
- Uniform
or chat with our tutors