
Navigation » List of Schools, Subjects, and Courses » Math 136 – Introduction to Statistics » Quiz 2 » Quiz 2 Question 7
No Answers We dont have answer to this question yet. If you need help with your homework send us an email  or chat with our tutors
Quiz 2 Question 7
Question
Quiz 2
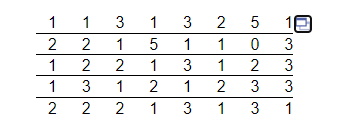
7. A researcher wanted to determine the number of televisions in households. He conducts a survey of 40 randomly selected households and obtained the data to the right. Draw a dot plot of the televisions per household.
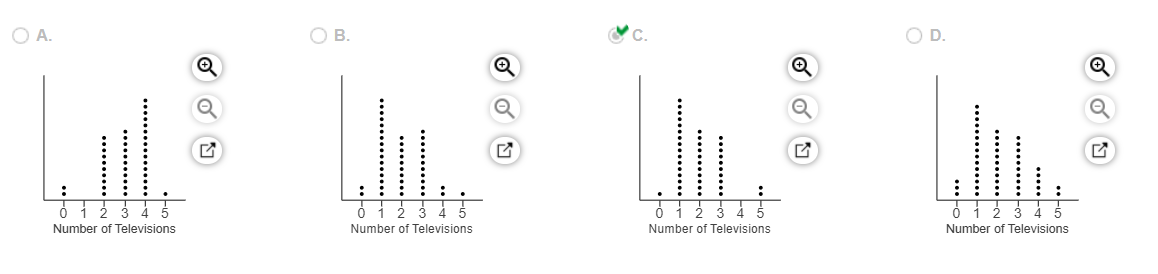
Choose the correct dot plot below.
We don’t have answer to this question yet.If you need help with your homework send us an email at or chat with our tutors
or chat with our tutorsThis question is taken from Math 136 – Introduction to Statistics » Summer 2021 » Quiz 2