
Navigation » List of Schools, Subjects, and Courses » Math 2210 – Statistics » Quizzes » Quiz 2 (Chapters 4 and 5) Question 4
No Answers We dont have answer to this question yet. If you need help with your homework send us an email  or chat with our tutors
Quiz 2 (Chapters 4 and 5) Question 4
Quiz 2
4. The accompanying graph shows the percentage of winners of a horse race that have run slower than a given speed. Note that few have won running less than 33 miles per hour, but about 85% of the winning horses have run less than 37 miles per hour. (A cumulative frequency graph like this is called an “ogive.”) Using only the graph, complete parts a through e below.
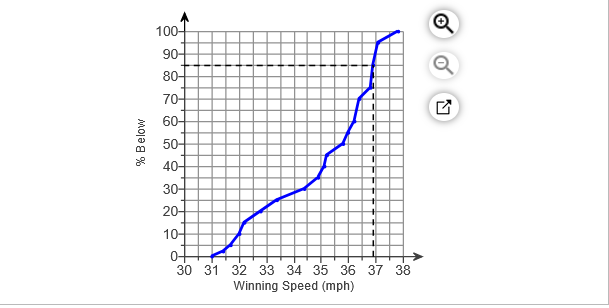
a) Estimate the median winning speed.
The median winning speed is ____ mph (Round to one decimal place as needed.)
b) Estimate the quartiles.
The lower quartile is ____ mph. (Round to one decimal place as needed.)
The upper quartile is ____ mph. (Round to one decimal place as needed.)
c) Estimate the range and the IQR.
The range is ____ mph. (Round to one decimal place as needed.)
The IQR is ____ mph. (Round to one decimal place as needed.)
e) Write a few sentences about the speeds of the horse race winners. The distribution of speeds is skewed to the left.
The typical horse race winner has a speed of ____ mph. Most of the horse race winners are between first quartile ____ mph and third quartile ___ mph (Round to one decimal place as needed.)
or chat with our tutors