Navigation » List of Schools, Subjects, and Courses » Math 2210 – Statistics » Quizzes » Quiz 1 (Chapters 1, 2 and 3) Question 7
No Answers We dont have answer to this question yet. If you need help with your homework send us an email  or chat with our tutors
Quiz 1 (Chapters 1, 2 and 3) Question 7
Question
Quiz 1
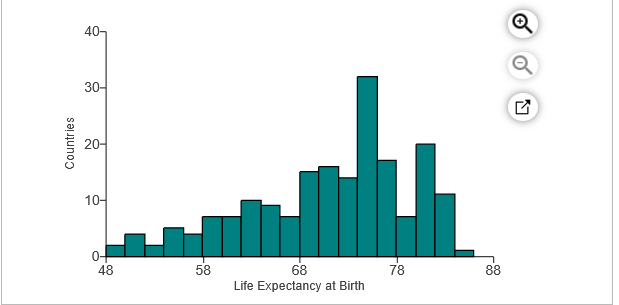
7. The accompanying histogram shows the life expectancies at birth for 190 countries as collected by an international health agency.
a) Describe the shape.
b) How many modes does the histogram have?

a) Choose the correct answer below.
- The distribution is uniform.
- The distribution is symmetric.
- The distribution is skewed left.
- The distribution is skewed right.
b) Choose the correct answer below.
- There appears to be one mode, at 74 to 76 years.
- There appears to be one mode, at 80 to 82 years.
- There appears to be two modes, at 64 to 66 years and at 74 to 76 years.
- The distribution does not have any modes.
We don’t have answer to this question yet.If you need help with your homework send us an email at  or chat with our tutors
 or chat with our tutors
This question is taken from Math 2210 – Statistics » Summer 2020 » Quizzes

