Navigation » List of Schools, Subjects, and Courses » Math 190 – Calculus with Analytic Geometry » Exams » Exam 1 » Exam 1 Sample Answers

Exam 1
1. Find the domain of the function. (Enter your answer using interval notation.)
2. Find the domain of the function. (Enter your answer using interval notation.)
3. Find the domain of the function. (Enter your answer using interval notation.)
4. Determine whether the following statement is true or false.
If
- True
- False
5. Find the domain of the function. (Enter your answer using interval notation.)
6. Find f ∘ g ∘ h.
7. Evaluate f(−7), f(0), and f(9) for the piecewise defined function.
f(−7) =
f(0) =
f(9) =
Sketch the graph of the function.
8. If the point (2, 6) is on the graph of an even function, what other point must also be on the graph?
If the point (2, 6) is on the graph of an odd function, what other point must also be on the graph?
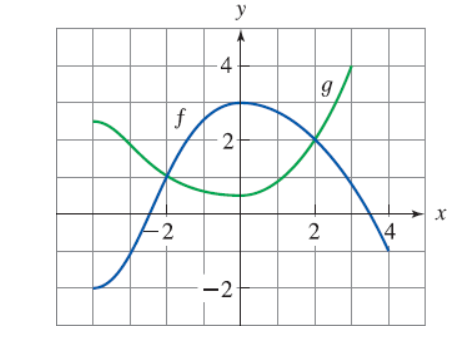
9. The graphs of f and g are given in the figure.

- State the values of f(0) and g(−2)
- Which is larger, f(1) or g(1)?
- For what values of x is f(x) = g(x)? (Enter your answers as a comma-separated list.)
- On what interval(s) is f(x) ≤ g(x)? (Enter your answer using interval notation.)
- State the solution of the equation f(x) = −1. (Enter your answers as a comma-separated list.)
- On what interval(s) is g decreasing? (Enter your answer using interval notation.)
- State the domain and range of f. (Enter your answers using interval notation.
- Domain
- Range
- State the domain and range of g. (Enter your answers using interval notation.)
- Domain
- Range
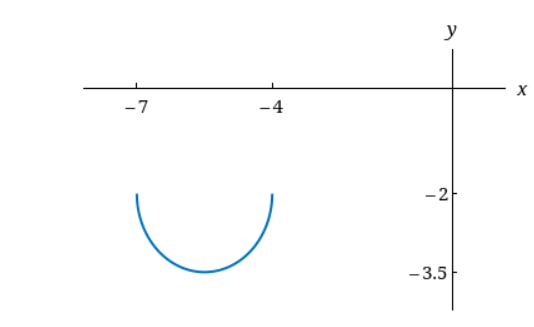
10. Use the Vertical Line Test to determine whether the curve is the graph of a function x. State the domain and range of the function. (If the curve is not a function, choose NONE.)
- The given curve is the graph of a function of x, by the Vertical Line Test.
- The given curve is not the graph of a function of x, by the Vertical Line Test.
Domain:
Range:
11. A cardiac monitor is used to measure the heart rate of a patient after surgery. It compiles the number of heartbeats after t minutes. When data in the table are graphed, the slope of the tangent line represents the heart rate in beats per minute.

The monitor estimates this value by calculating the slope of a secant line. Use the data to estimate the patient’s heart rate after 42 minutes using the secant line between the points with the given values of t. (Round your answers to one decimal place.)
t = 36 and t = 42
t = 38 and t = 42
t = 40 and t = 42
t = 42 and t = 44
12. Evaluate the difference quotient for the given function. Simplify your answer.
13. The graph of

Use transformations to create a function whose graph is as shown

y =
14. Express the function in the form f ∘ g if g(x)
15. Graph the function by hand, not by plotting points, but by starting with the graph of one of the standard functions given in Section 1.2 and then applying the appropriate transformations.
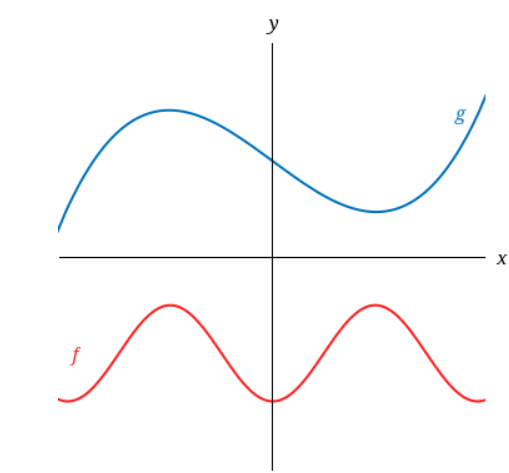
16. Graphs of f and g are shown.

Is f even, odd, or neither?
Explain your reasoning.
Is g even, odd, or neither?
Explain your reasoning.
17. Find a formula for the described function.
Express the area A of an equilateral triangle as a function of the length of a side x.
=
State the domain of A. (Enter your answer using interval notation.)
18. A graphing calculator is recommended.
Determine whether f is even, odd, or neither. Use technology to check your answer visually.
- Odd
- Even
- Neither
19. Find functions f and g such that F = f ∘ g. (Use non-identity functions for f(x) and g(x).)
20. Find each of the following functions and state their domains. (Enter the domains in interval notation.)
A. f+g =
Domain
B. f-g
Domain
C. fg=
Domain
D.
Domain
Exam 1 Answer
1.
.
2.


