
Navigation » List of Schools, Subjects, and Courses » Math 227 – Statistics » Quizzes » Chapter 7 Quiz » Chapter 7 Quiz Sample Answers

Chapter 7 Quiz
1. One graph in the figure represents a normal distribution with mean and standard deviation . The other graph represents a normal distribution with mean and standard deviation . Determine which graph is which and explain how you know.
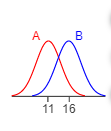
- Graph A has a mean of 16 and graph B has a mean of 11 because a larger mean shifts the graph to the right.
- Graph A has a mean of 11 and graph B has a mean of 16 because a larger mean shifts the graph to the left.
- Graph A has a mean of 16 and graph B has a mean of 11 because a larger mean shifts the graph to the left.
- Graph A has a mean of 11 and graph B has a mean of 16 because a larger mean shifts the graph to the right.
2. Steel rods are manufactured with a mean length of 28 centimeter (cm). Because of variability in the manufacturing process, the lengths of the rods are approximately normally distributed with a standard deviation of 0.09 cm. Complete parts (a) to (d).
(a) What proportion of rods has a length less than 27.8 cm? ____ (Round to four decimal places as needed.)
(b) Any rods that are shorter than 27.78 cm or longer than 28.22 cm are discarded. What proportion of rods will be discarded? ____ (Round to four decimal places as needed.)
(c) Using the results of part (b), if 5000 rods are manufactured in a day, how many should the plant manager expect to discard? ___ (Use the answer from part b to find this answer. Round to the nearest integer as needed.)
(d) If an order comes in for 10000 steel rods, how many rods should the plant manager expect to manufacture if the order states that all rods must be between 27.8 cm and 28.2 cm? _____ (Round up to the nearest integer.)
3. The mean incubation time of fertilized eggs is 20 days. Suppose the incubation times are approximately normally distributed with a standard deviation of 1 day.
(a) Determine the 10th percentile for incubation times.
(b) Determine the incubation times that make up the middle 39% of fertilized eggs.
(a) The 10th percentile for incubation times is ___ days. (Round to the nearest whole number as needed.)
(b) The incubation times that make up the middle 39% of fertilized eggs are __ to ___ days. (Round to the nearest whole number as needed. Use ascending order.)
4. The graph of a normal curve is given. Use the graph to identify the value of and .
is ___
is ___
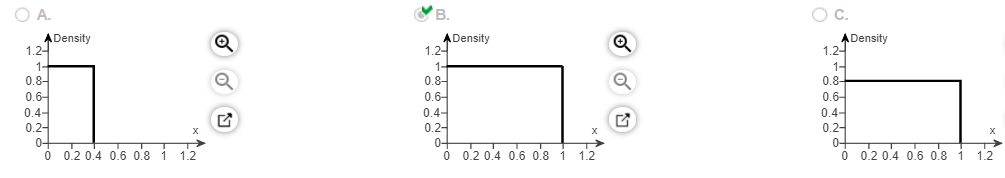
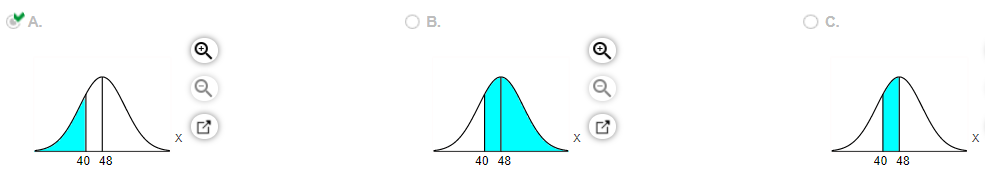
5. Assume that the random variable X is normally distributed, with mean and standard deviation . Compute the probability. Be sure to draw a normal curve with the area corresponding to the probability shaded.
Which of the following shaded regions corresponds to ?
6. The time required for an automotive center to complete an oil change service on an automobile approximately follows a normal distribution, with a mean of 15 minutes and a standard deviation of 3 minutes.
(a) The automotive center guarantees customers that the service will take no longer than 20 minutes. If it does take longer, the customer will receive the service for half-price. What percent of customers receive the service for half-price?
(b) If the automotive center does not want to give the discount to more than 2 % of its customers, how long should it make the guaranteed time limit?
(a) The percent of customers that receive the service for half-price is ___%.
(Round to two decimal places as needed.)
(b) The guaranteed time limit is ___ minutes. (Round up to the nearest integer as needed.)
Chapter 7 Quiz Answers
1. D. Graph A has a mean of 11 and graph B has a mean of 16 because a larger mean shifts the graph to the right.