
Navigation » List of Schools, Subjects, and Courses » Math 136 – Introduction to Statistics » Homework Assignment » Week 6 Homework Assignment » Week 6 Homework Assignment Sample Answers

Week 6 Homework Assignment
1. Determine whether the following graph can represent a normal density function.
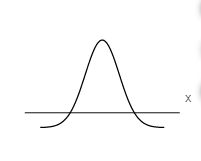
Could the graph represent a normal density function?
2. The graph of a normal curve is given. Use the graph to identify the value of
and
.
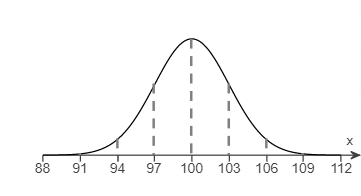
The value of
is
The value of
is
3. Determine the area under the standard normal curve that lies to the right of (a) Z = -0.13, (b) Z = -0.83, (c) Z = -0.93, and (d) Z = 0.69
(a) The area to the right of Z = -0.13 is____
(b) The area to the right of Z = – 0.83 is _____
(c) The area to the right of Z = -0.93 is _____
(d) The area to the right of Z = 0.69 is _____
4 Determine the area under the standard normal curve that lies between (a) Z = -0.86 and Z = 0.86, (b) Z = -2.72, and (c) Z = -2.07 and Z= 0-0.79
(a) The area to the right of Z = -0.86 and Z=0.86 is____
(b) The area to the right of Z = – 2.72 and Z = 0 is _____
(c) The area to the right of Z = -2.07 and Z = -0.79 is _____
5. Determine the total area under the standard normal curve in parts (a) through (c) below.
(a) Find the area under the normal curve to the left of z = -1 plus the area under the normal curve to the right of z = 1
The combined area is ______
(b) Find the area under the normal curve to the left of z = -1.53 plus the area under the normal curve to the right of z=2.53.
The combined area is
(c) Find the area under the normal curve to the left of z = -0.22 plus the area under the normal curve to the right of z=1.40.
The combined area is
6. Find the z-score such that the area under the standard normal curve to the left is 0.97.
1.88 is the z-score such that the area under the curve to the left is 0.97 .
(Round to two decimal places as needed.)
7. Find the z-score such that the area under the standard normal curve to the right is 0.29.
The approximate z-score that corresponds to a right tail area of 0.29 is _____ (Round to two decimal places as needed.)
8. Find the z-scores that separate the middle 42% of the distribution from the area in the tails of the standard normal distribution.
The z-scores are ______ (Use a comma to separate answers as needed. Round to two decimal places as needed.)
9. Assume the random variable X is normally distributed with mean =50 and standard deviation =7. Compute the probability. Be sure to draw a normal curve with the area corresponding to the probability shaded
P(X>36)
Which of the following normal curves corresponds to P(X>36).
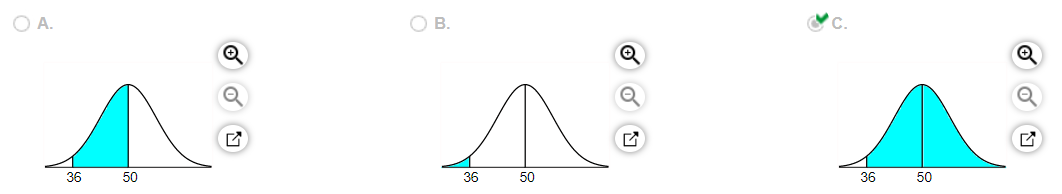
P(X>36) = _____
10 Assume that the random variable X is normally distributed, with mean =55 and standard deviation =11 . Compute the probability. Be sure to draw a normal curve with the area corresponding to the probability shaded.
P(X
48)
Which of the following shaded regions corresponds to P(X
48)
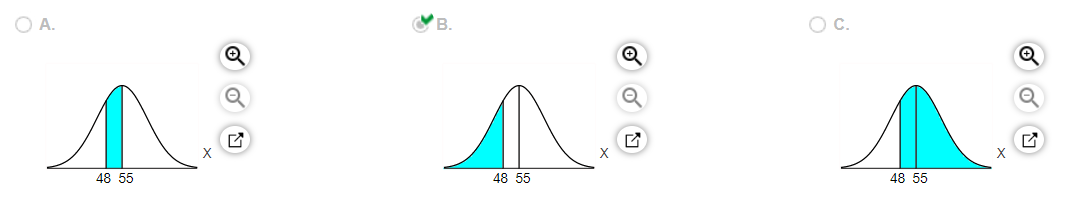
P(X
48) = ____
11 Assume the random variable X is normally distributed with mean =50 and standard deviation =7 . Compute the probability. Be sure to draw a normal curve with the area corresponding to the probability shaded.
P(35<x<58)
Which of the following normal curves corresponds to P(35<X<58) ?
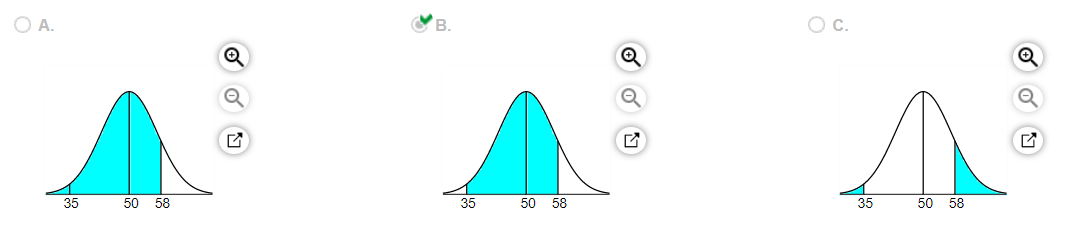
P(35<x<58) = ____
12. Assume the random variable X is normally distributed with mean =50 and standard deviation =7 . Compute the probability. Be sure to draw a normal curve with the area corresponding to the probability shaded.
Which of the following normal curves corresponds to
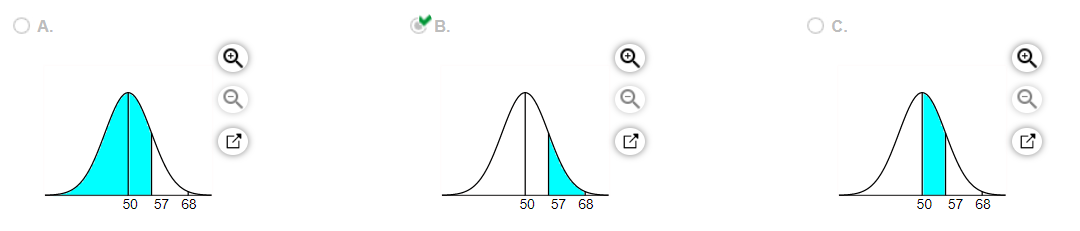
= ____
13. Assume that the random variable X is normally distributed, with mean 45 and standard deviation =10 . Compute the probability
. Be sure to draw a normal curve with the area corresponding to the probability shaded.
Draw a normal curve with the area corresponding to the probability shaded. Choose the correct graph below.
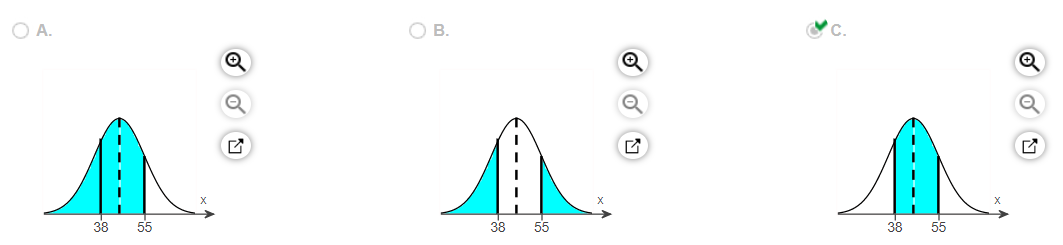
= _____
14. Assume the random variable X is normally distributed with mean 50 and standard deviation 7. Find the 77th percentile.
The 77th percentile is ______________
15. The mean incubation time for a type of fertilized egg kept at a certain temperature is 17 days. Suppose that the incubation times are approximately normally distributed with a standard deviation of 1 day . Complete parts (a) through (e) below.
(b) Find and interpret the probability that a randomly selected fertilized egg hatches in less than 15 days.
The probability that a randomly selected fertilized egg hatches in less than days is _____
Interpret this probability. Select the correct choice below and fill in the answer box to complete your choice. (Round to the nearest integer as needed.)
If 100 fertilized eggs were randomly selected, exactly ____ would be expected to hatch on day 15 .
If 100 fertilized eggs were randomly selected, __ of them would be expected to hatch in less than 15 days.
In every group of 100 fertilized eggs, __ eggs would be expected to hatch in less than 15 days.
(c) Find and interpret the probability that a randomly selected fertilized egg takes over 19 days to hatch.
The probability that a randomly selected fertilized egg takes over 19 days to hatch is _____. (Round to four decimal places as needed.)
Interpret this probability. Select the correct choice below and fill in the answer box to complete your choice. (Round to the nearest integer as needed.)
If 100 fertilized eggs were randomly selected, exactly ____ would be expected to hatch on day 19.
If 100 fertilized eggs were randomly selected, ___ of them would be expected to take more than 19 days to hatch.
In every group of 100 fertilized eggs, ____ eggs would be expected to hatch in more than 19 days.
(d) Find and interpret the probability that a randomly selected fertilized egg hatches between 16 and 17 days is _____
The probability that a randomly selected fertilized egg hatches between 16 and 17 days is _____ (Round to four decimal places as needed.)
Interpret this probability. Select the correct choice below and fill in the answer box to complete your choice. (Round to the nearest integer as needed.)
In every group of 100 fertilized eggs, ___ eggs would be expected to hatch between 16 and 17 days.
If 100 fertilized eggs were randomly selected, exactly ____ would be expected to hatch on day 16 or on day 17.
If 100 fertilized eggs were randomly selected, ___ of them would be expected to hatch between 16 and 17 days.
(e) Would it be unusual for an egg to hatch in less than 14 days? Why?
The probability of an egg hatching in less than 14 days is ______ so it _____ be unusual since the probability is ____ than 0.05
16. The number of chocolate chips in an 18-ounce bag of chocolate chip cookies is approximately normally distributed with a mean of 1252 chips and standard deviation 129 chips.
(a) What is the probability that a randomly selected bag contains between 1000 and 1500 chocolate chips, inclusive?
(b) What is the probability that a randomly selected bag contains fewer than 1050 chocolate chips?
(c) What proportion of bags contains more than 1200 chocolate chips?
(d) What is the percentile rank of a bag that contains 1000 chocolate chips?
17. A study found that the mean amount of time cars spent in drive-throughs of a certain fast-food restaurant was 158.2 seconds. Assuming drive-through times are normally distributed with a standard deviation of 33 seconds, complete parts (a) through (d) below.
(a) What is the probability that a randomly selected car will get through the restaurant’s drive-through in less than 102 seconds?
(b) What is the probability that a randomly selected car will spend more than 201 seconds in the restaurant’s drive-through?
(c) What proportion of cars spend between 2 and 3 minutes in the restaurant’s drive-through?
(d) Would it be unusual for a car to spend more than 3 minutes in the restaurant’s drive-through? Why?
18. The lengths of a particular animal’s pregnancies are approximately normally distributed, with mean of 274 days and standard deviation 16 days.
(a) What proportion of pregnancies lasts more than 294 days?
(b) What proportion of pregnancies lasts between 254 and 286 days?
(c) What is the probability that a randomly selected pregnancy lasts no more than 242 days?
(d) A “very preterm” baby is one whose gestation period is less than 250 days. Are very preterm babies unusual?
19. Suppose that the lifetimes of light bulbs are approximately normally distributed, with a mean of 57 hours and a standard deviation of 3.5 hours. With this information, answer the following questions.
(a) What proportion of light bulbs will last more than 61 hours?
(b) What proportion of light bulbs will last 52 hours or less?
(c) What proportion of light bulbs will last between 59 and 62 hours?
(d) What is the probability that a randomly selected light bulb lasts less than 45 hours?
20. Steel rods are manufactured with a mean length of 29 centimeter (cm). Because of variability in the manufacturing process, the lengths of the rods are approximately normally distributed with a standard deviation of 0.08 cm. Complete parts (a) to (d).
(a) What proportion of rods has a length less than 28.9 cm?
(b) Any rods that are shorter than 28.81 cm or longer than 29.19 cm are discarded. What proportion of rods will be discarded?
(c) Using the results of part (b), if 500 rods are manufactured in a day, how many should the plant manager expect to discard?
(d) If an order comes in for 10,000 steel rods, how many rods should the plant manager expect to manufacture if the order states that all rods must be between 28.9 cm and 29.1 cm?
Week 6 Homework Assignment Answers